
Fig. 2.
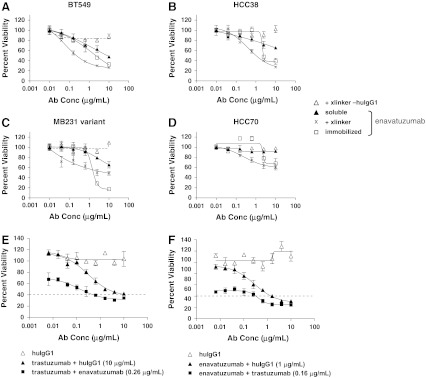
Growth inhibition of breast cancer cell lines by enavatuzumab and synergy of inhibition when combined with trastuzumab. a–d BT549 (a), HCC38 (b), MB231 variant (c), and HCC70 (d) breast cancer cells were incubated with soluble enavatuzumab or human IgG1 control antibody in the presence (x, Δ) or absence (filled triangle, not shown) of cross-linking antibody, or immobilized enavatuzumab or control antibody (filled square, not shown) for 5–10 days. Relative viability was calculated by dividing the viability of treated cells by that of untreated cells. Representative data are shown here (point, mean of triplicate wells; bars, SEM). All experiments were repeated at least twice (E+F). SKBR3 cells were incubated with titrations of trastuzumab (e) or enavatuzumab with cross-linking secondary antibody (f) in the presence or absence of a single concentration of the other antibody (0.16 μg/mL trastuzumab and 0.26 μg/mL enavatuzumab are shown). At the effect size of 60 % inhibition (dashed line), the combination index (CI) was 0.27 for the enavatuzumab + trastuzumab combination and 0.28 for the trastuzumab + enavatuzumab combination, suggesting significant synergy between the two antibodies. Synergy was observed at the majority of antibody concentrations tested at effect sizes from 30 to 60 % inhibition (Supplemental Figure S1)