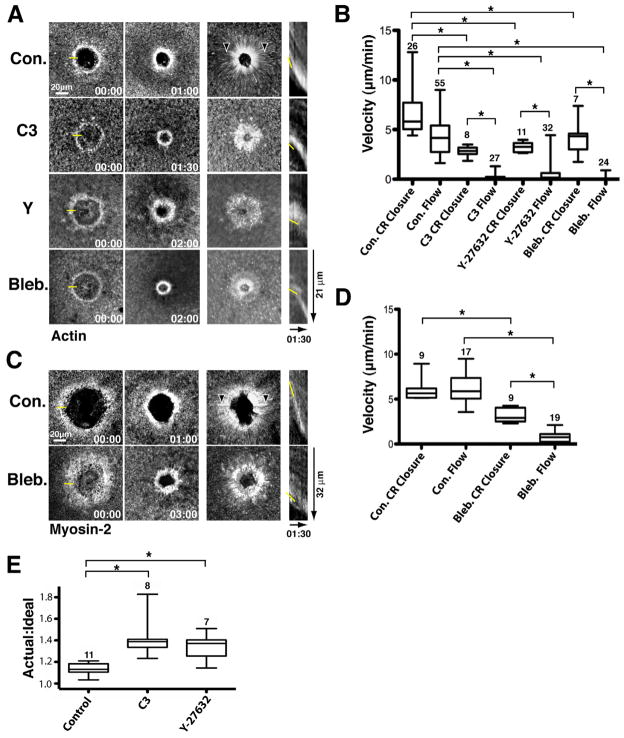
Figure 1.
Contractile ring closure without contraction. A. Actin cortical flow and ring closure. Left: Time points; middle: brightest point projections and; right: Kymographs (from 1 pixel-wide lines) of fluorescent actin following wounding of control (Con.) cells or cells microinjected with C3 exotransferase (C3), Y-27632 (Y) or blebbistatin (Bleb.) to suppress contraction. Yellow line in 00:00 time point indicates where line for kymograph was positioned. Arrowheads in control brightest point projection labels streaks of flowing actin. Yellow line in kymograph identifies position of leading edge. Time is in min:sec. B. Quantification (using fluorescent actin as a marker) of contractile ring (CR) closure and cortical flow (Flow) in controls (Con.) and cells microinjected with C3 exotransferase (C3), Y-27632 or blebbistatin (Bleb.) to suppress contraction. * indicates p < 0.05. Numbers indicate N. Bars indicate S.D. C. Myosin cortical flow and ring closure. Layout and labeling as in 1A but fluorescent myosin-2 used instead of fluorescent actin. D. Quantification of myosin flow and ring closure. Layout and labeling as in 1B, but fluorescent myosin-2 used instead of fluorescent actin. E. Comparison of the actual to the ideal circumference of contractile rings in control cells and cells microinjected with C3 exotransferase (C3) or Y-27632 (Y) to suppress contraction. See also Figure S1.

