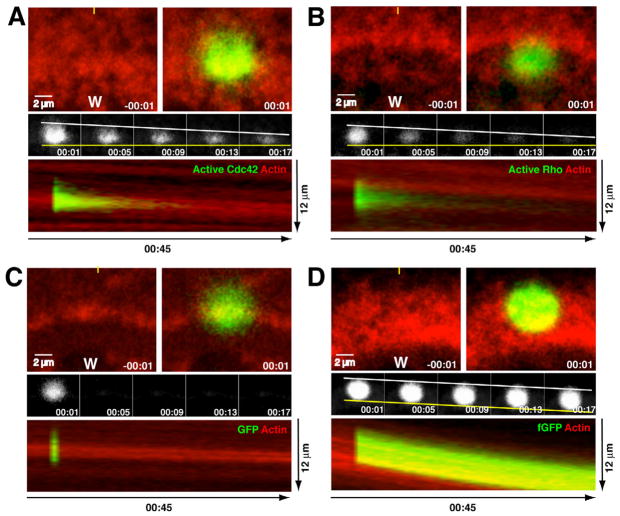
Figure 3.
Front-to-back bias in turnover of active GTPases at wound edge. A. Turnover of active Cdc42 at wound edge assessed with PA-GFP-wGBD (green) and fluorescent actin (red). Top left panel shows wound (w) edge immediately before photoactivation; top right panel shows wound edge immediately after photoactivation. Middle panels show active Cdc42 alone from same sample as top, with leading edge of photoactivated region indicated with a yellow line and the trailing edge indicated with a white line. Lowest panel shows kymograph generated from 5 pixel wide line positioned as indicated by yellow line in top left panel. The wound is at the bottom of the panel. B. Turnover of active Rho at wound edge assessed with PA-GFP-rGBD (green) and fluorescent actin (red). Layout and labels as in 3A. C. Turnover of probe for soluble proteins at wound edge assessed with PA-GFP (green) and fluorescent actin (red). Layout and labels as in 3A. D. Turnover of probe for stable PM-associated proteins at wound edge assessed with PA-fGFP (green) and fluorescent actin (red). Layout and labels as in 3A. See also Fig. S3.

