Figure 7.
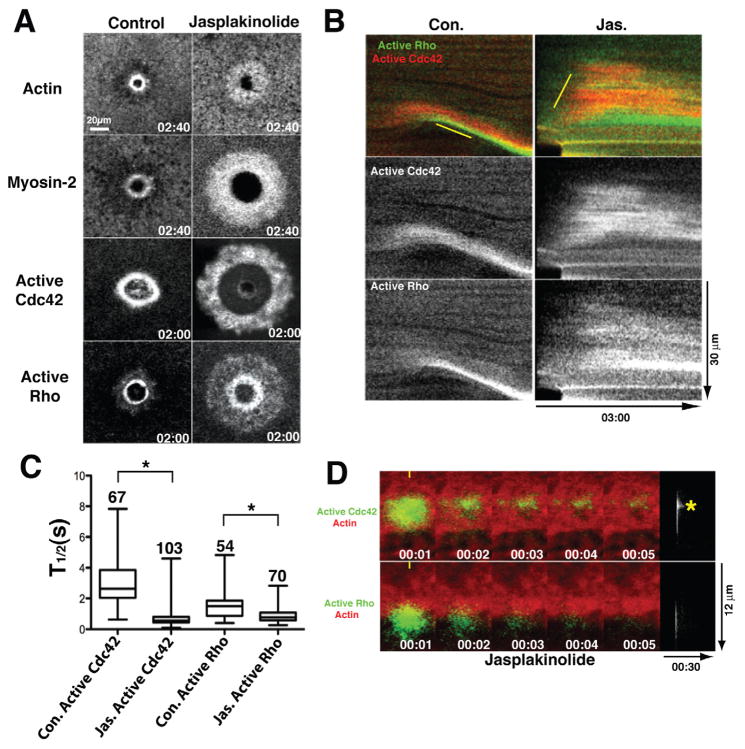
F-actin turnover is required for proper signal treadmill organization. A. Matched time points showing distribution of actin, myosin-2, active Cdc42 or active Rho in control cells and cells treated with jasplakinolide to suppress F-actin turnover. Time in min:sec and refers to the time post wounding. B. Kymographs made using 1 pixel-wide line showing distribution of active Cdc42 and Rho in control (Con.) and jasplakinolide (Jas.) treated cells. Top panels are double label; middle panels show active Cdc42 alone; bottom panels show active Rho alone. C. Quantification of total (ie of entire photoactivated regions) half life of active Cdc42 or active Rho in controls (Con.) or cells treated with jasplakinolide (Jas.) to suppress F-actin turnover. Asterisks indicate P < 0.05; numbers indicate N; bars indicate S.D. D. Top left panels show time points of active Cdc42 at wound edge assessed with PA-GFP-wGBD (green) and fluorescent actin (red) in presence of jasplakinolide; Top right panel shows active Cdc42 alone as kymograph (prepared as in fig. 3) from same sample as on left. Asterisk indicates persistence peak. Bottom left panels show time points of active Rho at wound edge assessed with PA-GFP-rGBD (green) and fluorescent actin (red) in presence of jasplakinolide; Bottom right panel shows active Rho alone as kymograph (prepared as in fig. 3) from same sample as on left. See also Fig. S5.

