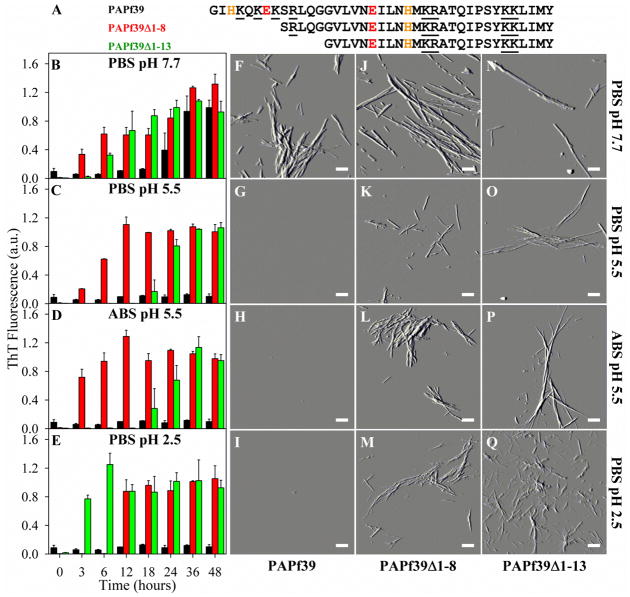
Figure 1.
Sequence of the PAPf39, PAPf39Δ1-8, and PAPf39Δ1-13 peptides (panel A) and the effect of pH on fibril formation as monitored by ThT fluorescence (panels B–E) and AFM imaging (panels F–Q). Black, red, and green bars are for the PAPf39, PAPf39Δ1-8, and PAPf39Δ1-13 peptides, respectively. AFM images for each peptide were taken after incubation for 48 hours in different buffers (specified for each row on the figure). Scale bars on the AFM images are 500 nm.

