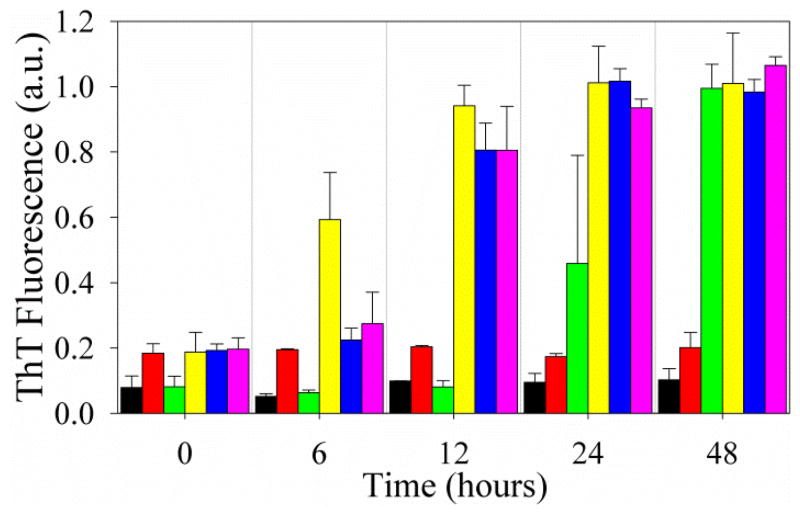
Figure 4.
Seeding of PAPf39 monomer with preformed PAPf39Δ1-8 fibrils at different pH values. ThT fluorescence intensity as a function of time for pH 5.5 no seed (black bars); pH 5.5 seed from pH 5.5 (red); pH 7.7 no seed (green); pH 7.7 seed from pH 7.7 (yellow); pH 7.7 seed from pH 5.5 (blue); and pH 7.7 seed from pH 2.5 (magenta). Seeding experiments where PAPf39 monomer is seeded with its own fibrils or PAPf39Δ1-13 fibrils, and corresponding AFM images are shown in Figure S3. See Experimental Procedures for more details on these experiments.

