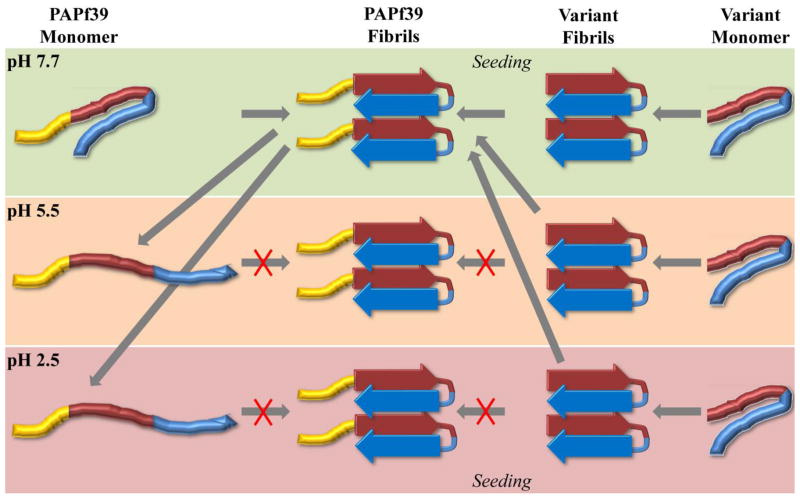
Figure 6.
Conceptual model of the pH dependence of PAPf39 fibril formation and dissociation. Yellow, red, and blue regions represent the N-terminal, central, and C-terminal regions of the PAPf39 peptide, respectively. Peptides lacking the yellow N-terminal region represent the variant peptides. Background color indicates the pH conditions (green, orange, and red for pH 7.7, pH 5.5, and pH 2.5, respectively). The cartoon representation of the fibrils is inspired by the X-ray structure 3PPD (22). The depicted monomer structures intend to illustrate changes in the overall conformational ensemble.

