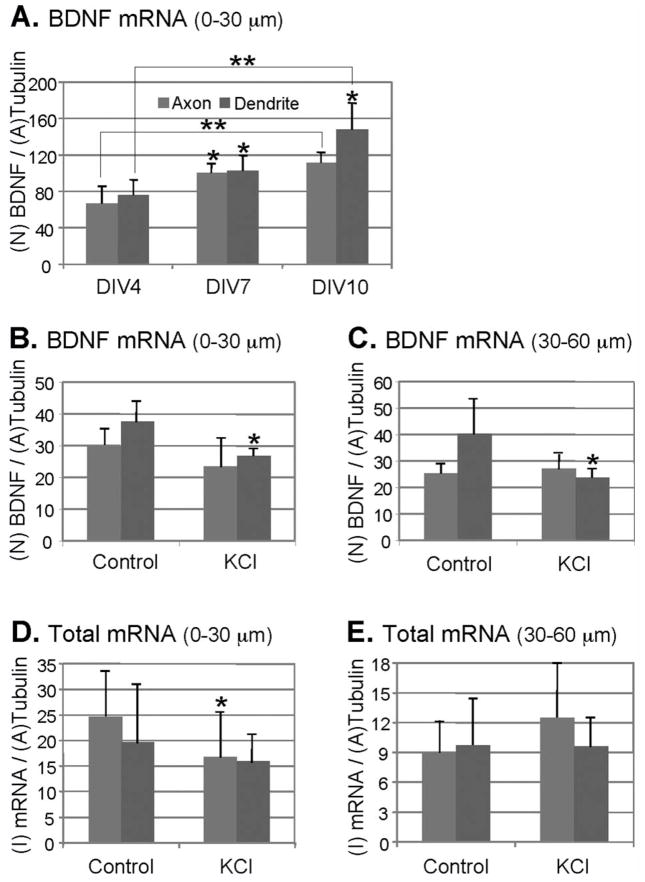
Figure 3.
Quantitative analysis of BDNF mRNA and total mRNA in cortical neurons. Y-axis: N, number; I, intensity; A, area. Axons and dendrites are shown in gray and dark gray bars, respectively. Student’s t test: *P < 0.05; **P < 0.01. See text for actual P-values. Error bars show standard deviations. A: Levels of BDNF mRNA granules (number-based analysis) in cortical neurons (0—30 μm segments) at different stages in culture (DIV4, DIV7, DIV10); n = 4. B, C: Levels of BDNF mRNA (number-based analysis) in axons and dendrites of DIV8 cortical neurons before and after depolarization with 50 mM KCl. Analyses were performed on (B) 0—30 μm, and (C) 30—60 μm segments. (B) n = 5; (C) n = 5 for axon; n = 4 for dendrite. D, E: Levels of total mRNA (intensity-based analysis) in DIV7 cortical neurons before and after depolarization with 50 mM KCl. Analysis was performed on (D) 0—30 μm, and (E) 30—60 μm segments; n = 9 for axon; n = 10 for dendrite.

