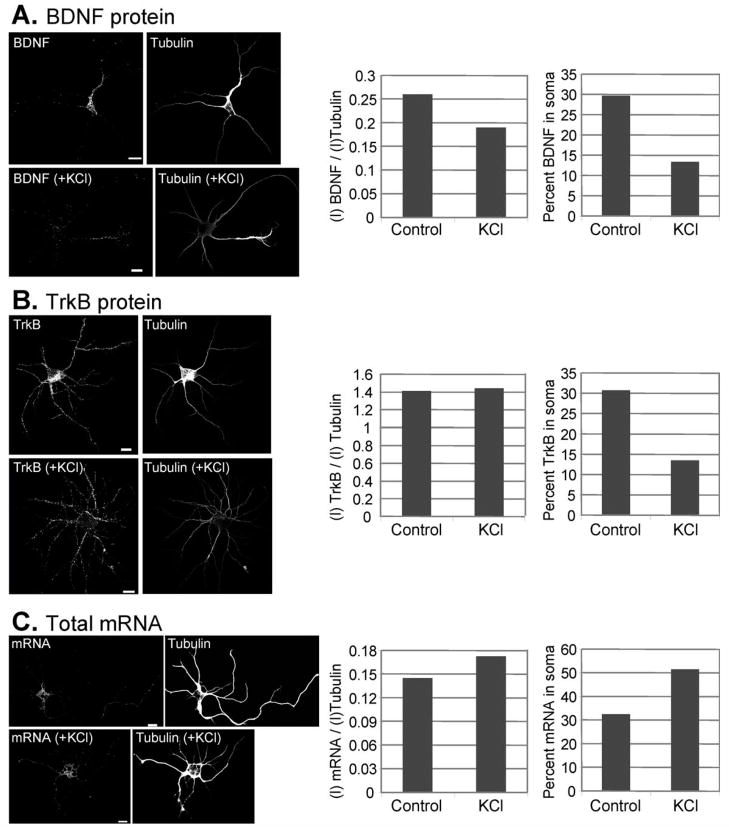
Figure 4.
Quantitative analysis of protein and mRNA in a single cell from DIV5 cortical neurons before and after depolarization. A: Levels of BDNF expression before and after depolarization with 50 mM KCl. Enrichment of BDNF can be seen in the distal parts of the neuron after depolarization. B: Levels of TrkB expression before and after depolarization with 50 mM KCl. C: Levels of total mRNA before and after depolarization with 50 mM KCl. Scale bar, 10 μm. The brightness and contrast of (A) and (C) were adjusted for better visualization. The statistical analysis for each experiment is shown in the right panel, which include quantitative data for total protein/mRNA normalized to α-tubulin, and percentage of protein/mRNA present in soma, before and after KCl treatment. Y-axis: I, intensity.

