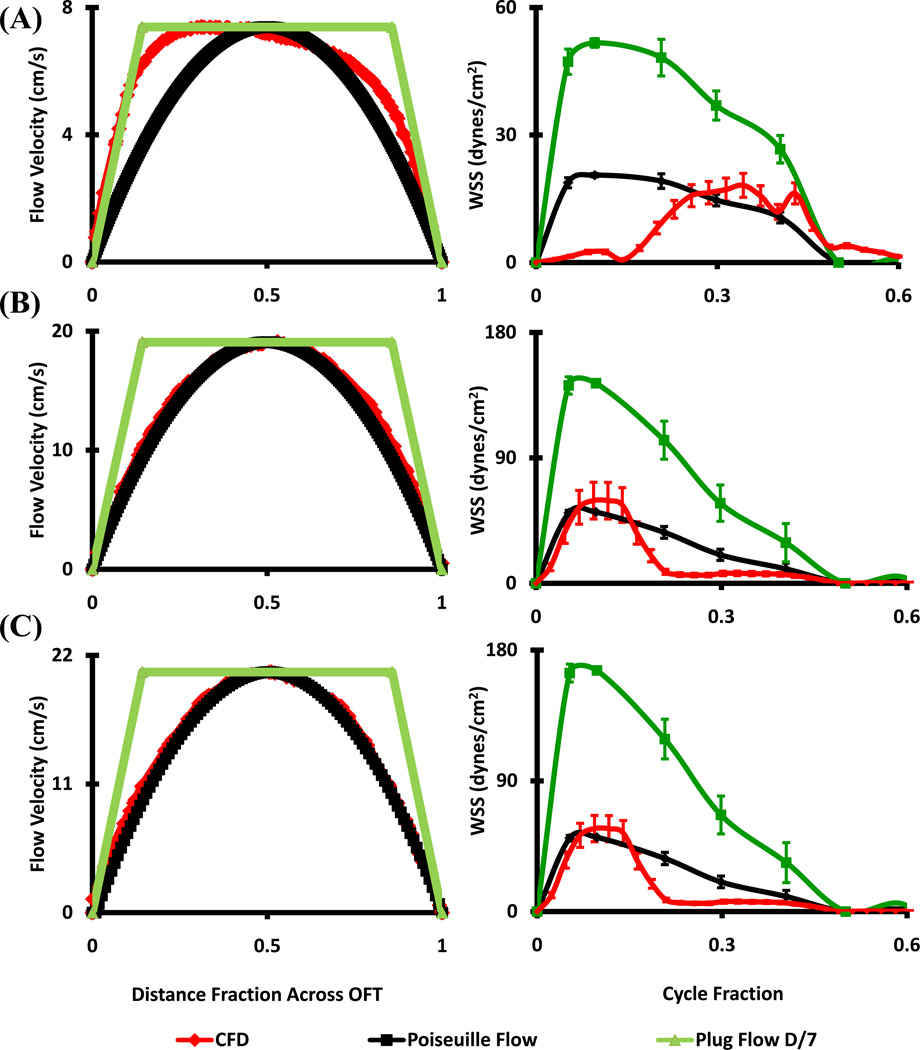
Figure 3.
Stage specific OFT orifice flow profiles at peak velocity (left) and spatially averaged WSS throughout cardiac cycle (right) as calculated by CFD and from ultrasound data with Poiseuille and Plug Flow (boundary layer 1/7th of the diameter) assumptions. (A) HH16. (B) HH23 - Proximal. (C) HH23 - Distal.

