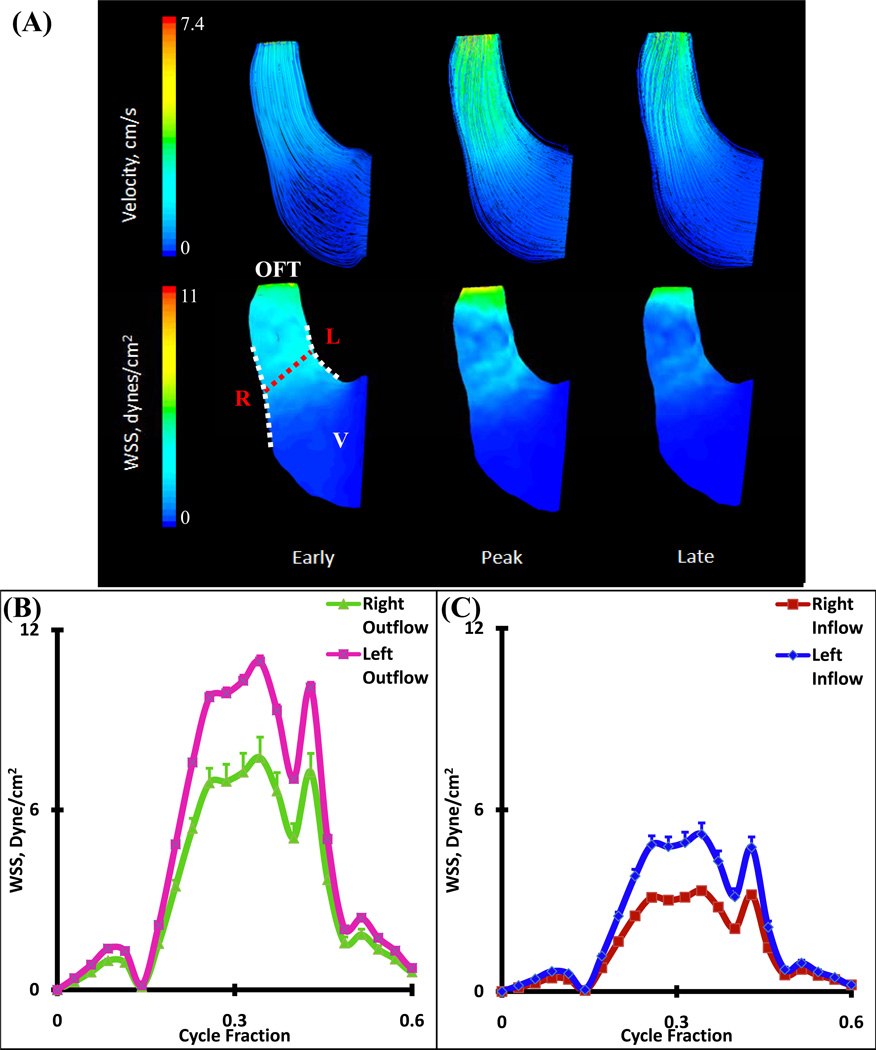
Figure 5.
(A) 3D hemodynamic environment in OFT region – Stage HH16. (B) Spatially averaged WSS on the Right and Left outflow regions (after mid cushion). (C) Spatially averaged WSS on the Right and Left inflow regions (before mid-cushion). Red Dotted Line – Mid-Cushion seperating inflow and outflow regions, R – Right region, L – Left region, White Dotted Line – Area of WSS data collected, OFT – Outflow Tract, V – Ventricle

