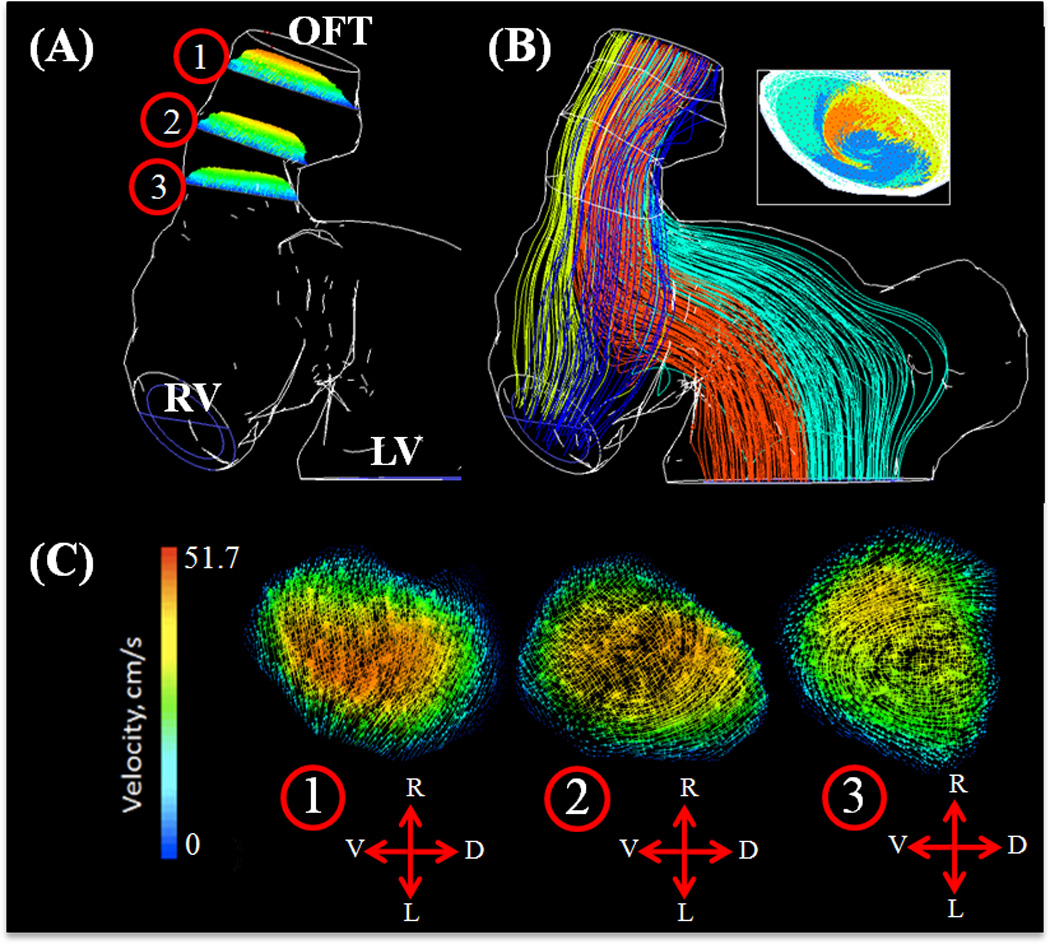
Figure 8.

(A) Velocity planes at select OFT regions – Stage HH27. Pathlines colored by velocity magnitude. Outline of complete wall geometry and associated locations of selected velocity planes. (B) Velocity path lines originating from each ventricle region with inset showing outflow mixing at peak velocity. (C) Velocity planes at (1) End outflow segment, (2) Distal cushion, (3) Beginning inflow segment, OFT – Outflow Tract, RV – Right Ventricle, LV – Left Ventricle. In direction arrows L – Left, R – Right, V – Ventral, D – Dorsal.
