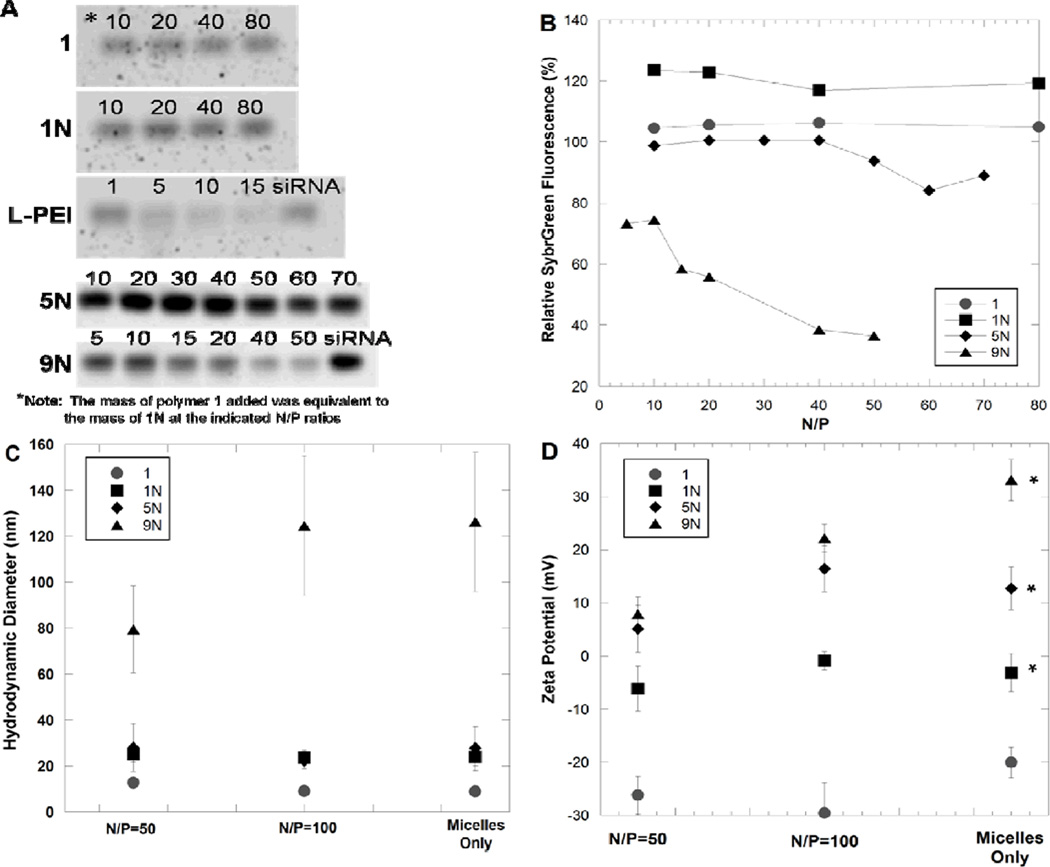
Figure 2.
Characterization of AM/siRNA complexes by gel electrophoresis (A and B), dynamic light scattering (C), and zeta potential (D). Relative SybrGreen fluorescence corresponds to unbound siRNA detected in an electrophoresis band normalized by a band of free siRNA (B). Images of gel electrophoresis bands are shown with the N/P ratio for each band denoted above the band, where the mass of polymer 1 added was equivalent to 1N at the indicated N/P ratios (A). Gel electrophoresis siRNA complexation studies were performed at least three times for each polymer, and one representative gel image and band quantification is shown here. The zeta potential measurements of each polymer were compared to each other at varying N/P ratios, and asterisks in D indicate polymers whose zeta potentials differed as a function of N/P ratio (p<0.05).

