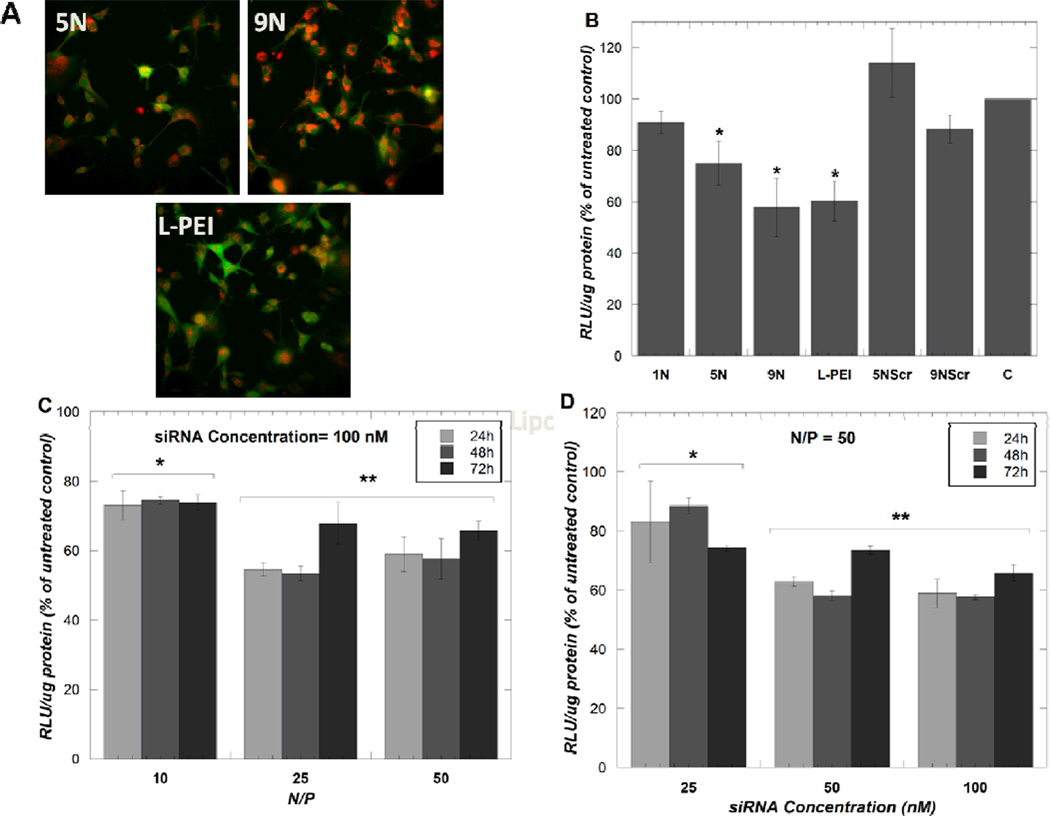
Figure 3.
Fluorescent microscope images of siRNA distribution (red) in U87-d1EGFP cells (green) when delivered by the indicated polymers (A) and luciferase silencing in U87-Luc cells 24 hours post-transfection (B). L-PEI was used at N/P=15. The samples 5NScr and 9NScr indicate treatments with a scrambled siRNA sequence. Time-course and dose titrations were performed of 9N /siRNA complexes to U87-Luc cells (C and D). Data represent mean ± standard deviation (n=3). Asterisks indicate treatments that elicited statistically significant luciferase silencing compared to the untreated control, C (B) or treatments that elicited statistically different luciferase silencing compared to the other treatment groups in the experiment (C and D) (p<0.05).

