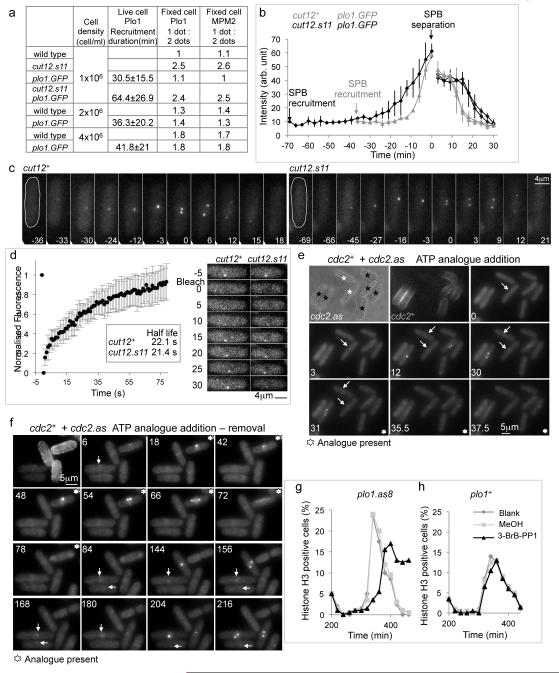
Figure 1. MPF activity controls Plo1.GFP recruitment to the SPB in late G2 phase.
a) Timing of Plo1.GFP recruitment before SPB separation (living cells) and the ratios of 1 dot (G2, early mitotic SPB) to two dots (mitotic SPB) MPM2 staining. b) Plots of the intensity of the Plo1.GFP signals averaged for three cells. In each case the two plots of different shading after SPBs split indicate the signals arising from two individual SPBs that emerge from this single focus of paired SPB signals in G2. intensity of the two (see also Supplementary movie 1). (c) Time lapse images of plo1.GFP and cut12.s11 plo1.GFP cells. (d) FRAP of the signal from a late G2 Plo1.GFP SPB in wild type cells (left). The FRAP profile of a cut12.s11 plo1.GFP strain was indistinguishable from this wild type plot (right; see also Supplementary movie 2). e, f) Wild type (TRITC-lectin pre-treated) and analogue sensitive (cdc2.as) cells (no coating) recorded side by side in the same field of view at 25°C. The timing the addition of 25μM 1NA-PP1 is indicated in the panel. Control cdc2+ cells advanced through mitosis irrespective of the presence of analogue with Plo1.GFP on their SPBs while Plo1.GFP signal left the SPBs of neighbouring cdc2.as mutant cells following analogue addition. White arrows indicate Plo1.GFP signals on SPBs. See also Supplementary movies 3, 4. g, h) Size selected cultures of either plo1.as8 (g) or plo1+ (h) cells were split into three following completion of the first synchronous division after size selection and treated as indicated in the legend to the graphs before processing for immunofluorescence with phospho-histone H3 serine 10 antibodies. The analogue 3-BrB-PP1 was added to a final concentration of 20 μM.

