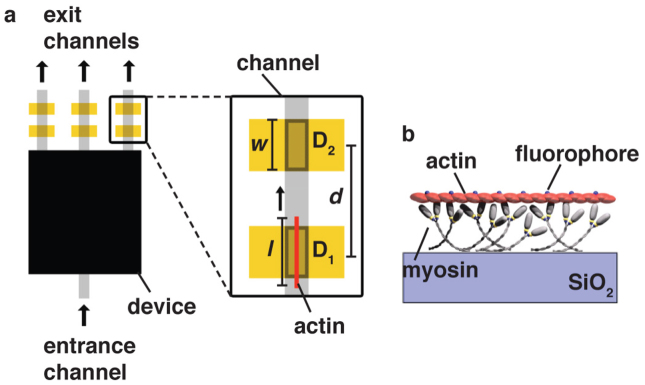
Figure 1. Schematic view of proposed readout regions in a future device, such as a biocomputation device.
a) The device itself is schematically shown as a black box, with entrance and exit channels. Detector points are here indicated at each exit channel of the network (but could be placed at any point of the device, as required by the application). Each detector point consists of a Au line of width w, for FLIC enhancement. The fluorescence originating from actin filaments l, crossing detection regions D1 and D2 from a pair of Au lines, with centre-to-centre spacing d, is read out by one or more CCD pixels each, and cross correlation analysis is used to remove errors from each of the signals. b) Schematic of actin transport by myosin on a SiO2 surface in an in vitro motility assay.

