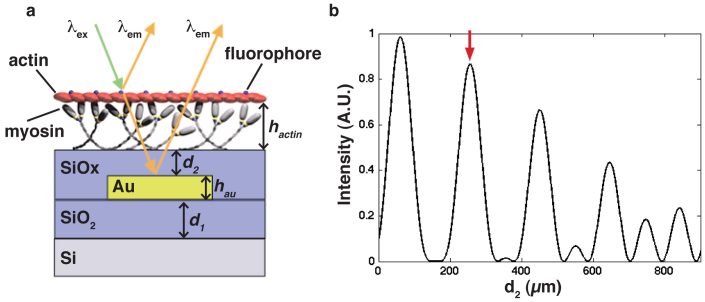
Figure 3. Schematic of FLIC concept and response curve for enhancement of filament contrast.
a) Myosin on the SiOx surface transports fluorescently labelled actin filaments at a height, hactin, above the SiOx surface. Incoming light excites the labelled actin filament causing fluorescence emission. Emitted light (λem) can travel directly to the detector or indirectly via reflection from the Au surface. Enhancement of fluorescence results if the two emission signals are in phase. The combination of reflective surfaces can be used to manipulate the fluorescence signal both on and off the Au lines. b) Varying the thickness, d2, shows the theoretical maximum and minimum intensities due to FLIC, see equation (2). Excitation λex and emission λem wavelengths are 540 and 605 nm for Tetra methyl Rhodamine Iso-Thiocyanate (TRITC) filter. Red arrow indicates corresponding thickness used for enhanced TRITC fluorescence on top of Au (see Fig. 4).

