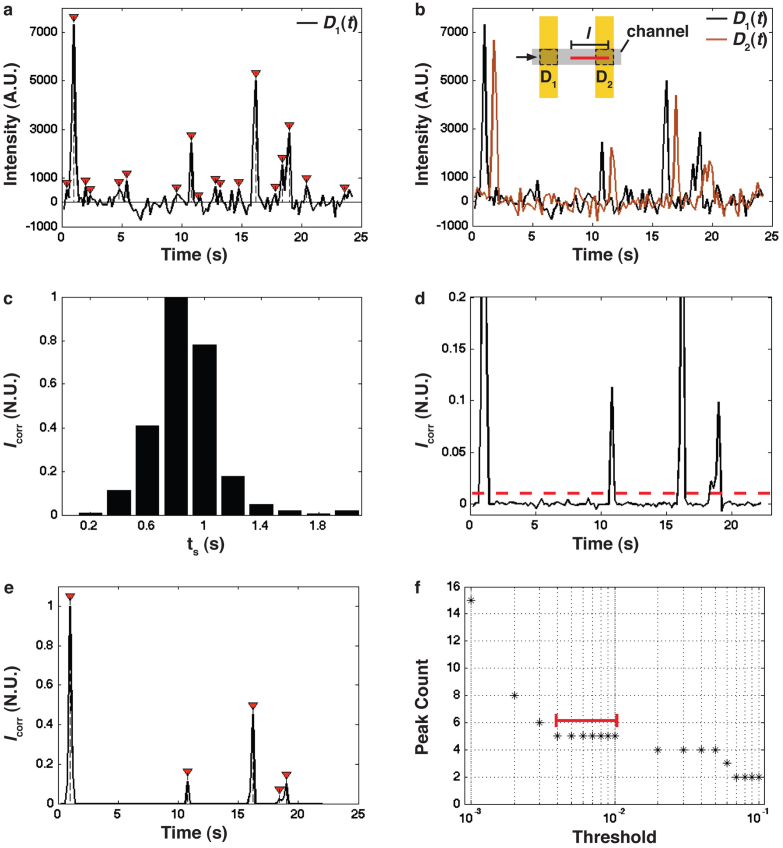
Figure 5. Cross correlation of FLIC signals for single filament detection.
a) Time series trace of fluorescence recorded in detector region D1 as filaments move over the Au line. Red arrows: peaks identified using the same peak-finding algorithm as in (e), resulting in many false positives: according to visual inspection, five filaments passed by the detector. A constant background was subtracted from the data. b) Background-subtracted fluorescence recorded in detector regions D1 and D2, each consisting of one Au line (w = 2 μm), with d = 7 μm (see Fig. 1). Inset: Schematic of detector regions. c) Cross correlation signal Icorr (see equation (1)) of the D1(t) and D2(t) signals from (b), as a function of ts, indicating that Icorr is maximal for ts,max = 0.8 s. d) The multiplied signal D1(t)*D2(t+ts,max) after normalizing. The dashed line shows the threshold level T = 0.01 used to produce the signal in (e). e) Black curve: Same data as in (d) after subtraction of 0.01 of the maximum. Red arrows: extracted peaks using a peak-finding algorithm (see text). f) Number of peaks identified as a function of the threshold level T applied to the cross correlated data set from (d), spanning from 0.001–0.1 of the maximum. Red bar: a threshold between 0.004 and 0.01 produces the correct result of five filaments.

