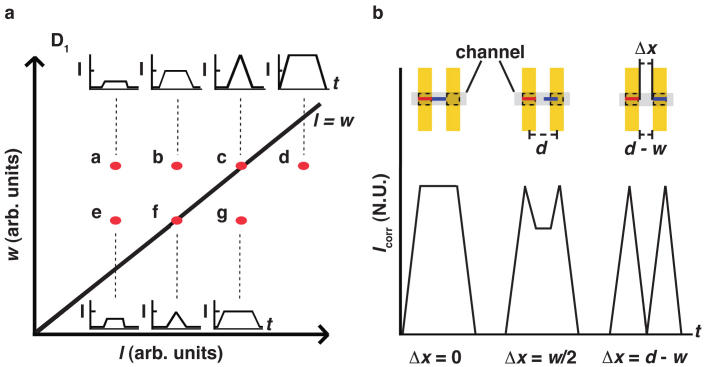
Figure 6. Schematic of signal dependence on filament length l and detector line width w as shown in Figure 1(a).
a) Schematic map of expected signal intensity in different locations (labelled a–g) in {l, w} parameter space for single filaments. For increasing filament length l (a–b) maximum intensity is obtained for l = w (c). Filaments with l > w (d) will not yield a higher intensity; they will only have the same intensity for a longer time. Decreasing w decreases signal amplitude (e–g). b) Study of the ability of a pair of detector lines to resolve two filaments travelling with end-to-end distance Δx and with l = w for optimal signal strength as a function of Δx. Two fully resolved peaks are obtained for Δx = d − w. Inset: schematic of detector geometry and filament end-to-end spacing Δx.

