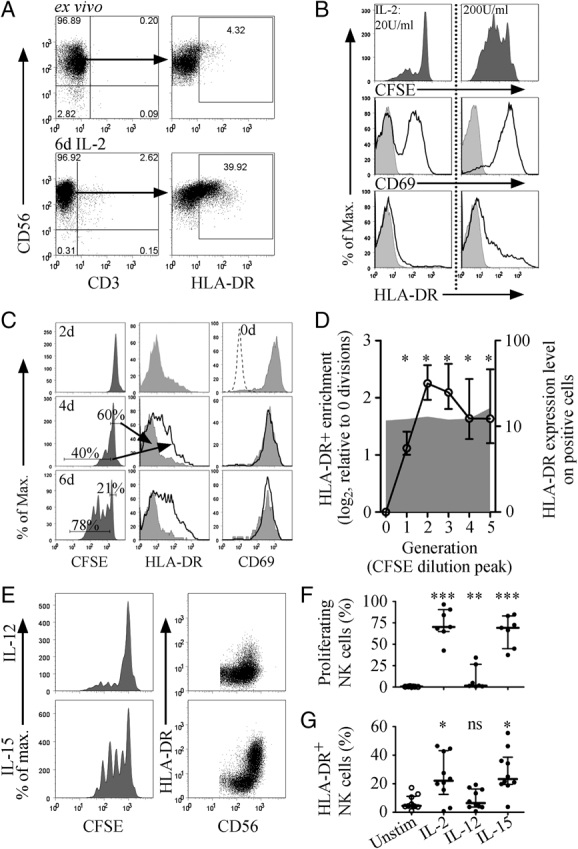
Figure 1.

A small circulating population of NK cells expressing HLA–DR expands with IL-2. (A) Freshly isolated NK cells were analysed ex vivo (top), and after 6 days culture with IL-2 (bottom), by flow cytometry for expression of HLA-DR on CD56+ CD3− NK cells. Plots for one donor (representative of >10 donors), showing CD56+ CD3− gates (left) and HLA-DR expression on the NK cells (right), gates show percentage HLA-DR+. (B) Freshly isolated human NK cells were labelled with CFSE and cultured for 6 days with rIL-2 at 20 U/mL (left) or 200 U/mL (right), then analysed by flow cytometry. Plots show proliferation by CFSE (top), expression of CD69 (middle) and HLA-DR (bottom), representative of two donors. (C) Freshly isolated human NK cells were labelled with CFSE and cultured for up to 6 days with rIL-2 (200 U/mL). NK cells were analysed by flow cytometry for expression of HLA-DR (middle) and CD69 (right) on non-proliferating (grey shaded) and proliferating (black line) NK cells as gated in the CFSE histogram (left). The CD69 plot for 2 days stimulation also includes the expression level ex vivo (dashed line). (D) Data for six donors comparing the percentage of HLA-DR+ NK cells (left axis, circles and black line) and the level of expression (geomean) of HLA-DR (right axis, grey shaded area) between each generation (distinct CFSE peaks). The percentage of HLA-DR+ NK cells is shown as a fold increase over the unproliferated cells, median±interquartile ranges, *p<0.05, tested by Wilcoxon matched pairs. The level of expression was calculated as the fold increase in the geometric mean of the HLA-DR+ NK cells relative to the total NK population. (E) Freshly isolated NK cells were labelled with CFSE and cultured with rIL-2, rIL-12 or rIL-15 for 6 days, then analysed for expression of HLA-DR by flow cytometry. Data from a representative donor showing CFSE profiles (left) and corresponding HLA-DR expression on CD56+ NK cells (right) for stimulation by IL-12 (top) and IL-15 (bottom). (F) Data for seven donors showing percentage of NK cells that had undergone at least one division and (G) the percentage of HLA-DR+ NK cells, *p<0.05, **p<0.01, ***p<0.001, tested by Wilcoxon matched pairs, median±interquartile range.
