Figure 2.

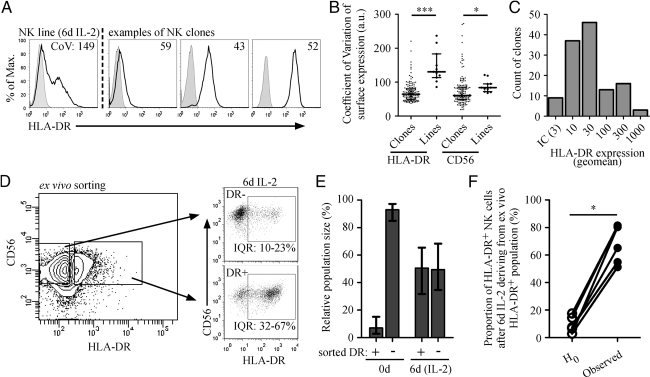
Expression levels of HLA-DR on NK cells are clonally restricted. NK cell clones were analysed by flow cytometry for expression of CD56 and HLA-DR. (A) The expression of HLA-DR on a polyclonal NK cell line after 6 days IL-2 culture (left) was compared with expression on individual clones derived from the same donor; three examples are shown (right). The coefficient of variation (CoV) of the expression of HLA-DR was calculated for each clone and cell line (indicated in top right of histograms). (B) Coefficient of variation data for expression of HLA-DR and CD56 from 143 clones from four independent donors, *p<0.05, ***p<0.0005, tested by Mann Whitney, median±interquartile range. (C) The expression level (geomean) of HLA-DR was analysed on 129 clones from four donors. (D) Freshly isolated human NK cells were sorted into CD56+/HLA-DR− (DR−) and CD56+/HLA-DR+ (DR+) populations. The sorted populations were cultured for 6 days with IL-2, then analysed by flow cytometry for expression of HLA-DR and CD56. Numbers beneath gates indicate interquartile ranges (IQR) of proportions of HLA-DR-expressing NK cells from six donors. (E) The relative population sizes of the sorted NK cell populations (−/+) were compared during sorting (0 days) and after 6 days culture with IL-2 (6d IL-2). Graphs show median±interquartile range. (F) The proportion of HLA-DR-expressing NK cells after 6 days culture with IL-2 that derived from those that initially expressed HLA-DR ex vivo was calculated. This was compared to a null hypothesis (H0) in which no preferential proliferation and no clonal restriction of HLA-DR expression was assumed. n=6, *p<0.05 tested by Wilcoxon matched pairs.
