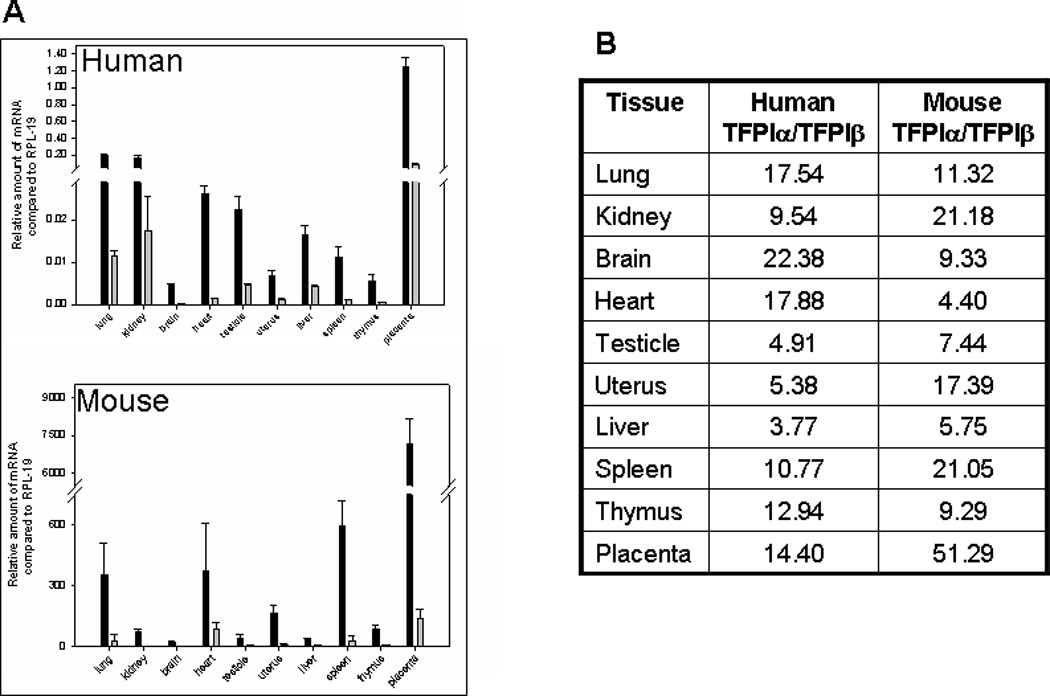
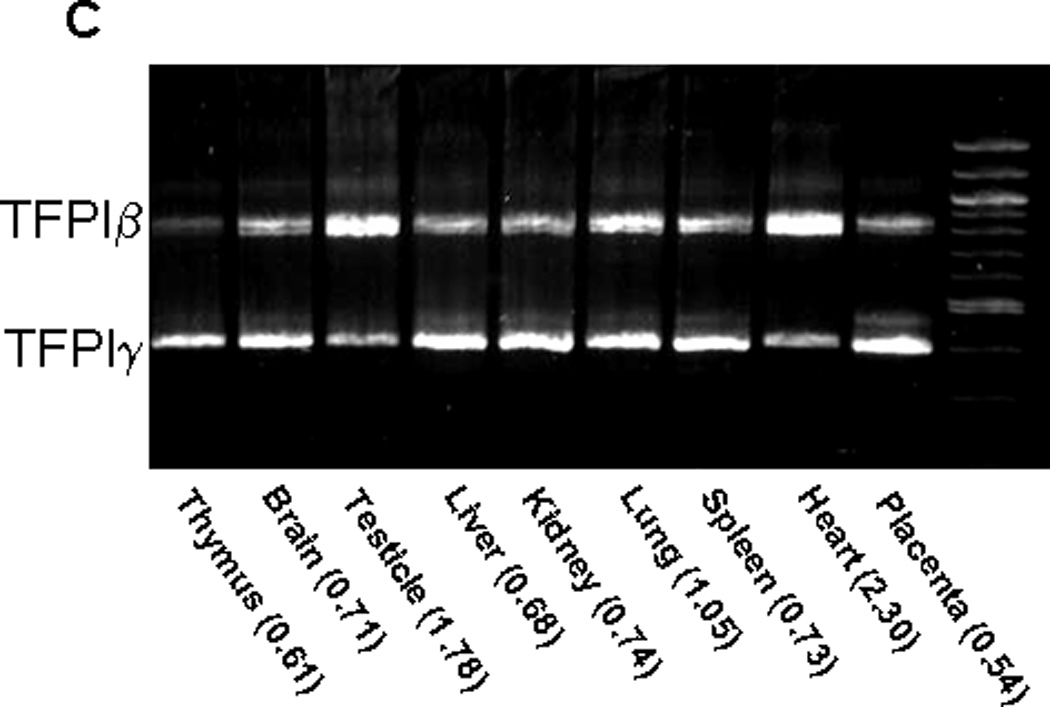
Figure 3.


TFPIα, TFPIβ and TFPIγ mRNA expression in human and mouse tissues. A) Quantitative real time PCR analysis of TFPIα and TFPIβ mRNA expression in human and mouse tissues compared to the housekeeper gene RPL-19. The bar graphs represent the average ± SD of 3 to 9 independent experiments performed using human and mouse cDNA. B) The ratios of TFPIα to TFPIβ mRNA in human and mouse tissues are presented demonstrating that there is more TFPIα mRNA than TFPIβ mRNA in all human and mouse tissues examined. C) cDNA obtained from mouse tissue was used as a template in a PCR reaction with a forward primer in the second Kunitz domain and a reverse primer distal to the TFPIγ region of exon 8. Two products are obtained corresponding to TFPIβ and TFPIγ. The intensity of the bands was quantified by densitometry. The TFPIβ:TFPIγ ratio for each tissue is indicated.
