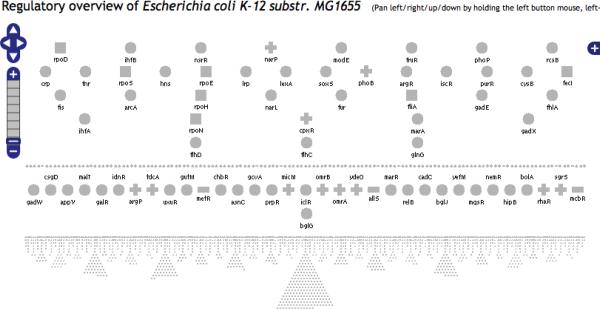
Figure 2.
The entire Regulatory Overview of E. coli using the `top to bottom' layout. The gene name appears near an icon if space is available. No regulatory relationships are shown, that is, no arrows are displayed. This is the most compact overview available. The genes on the same row do not directly regulate each other. The bottom row has all the genes that do not regulate any gene but are regulated by at least one gene (this row corresponds to the outer most ellipse of the `nested ellipses' layout). The top row has the regulators that regulate the largest number of genes.

