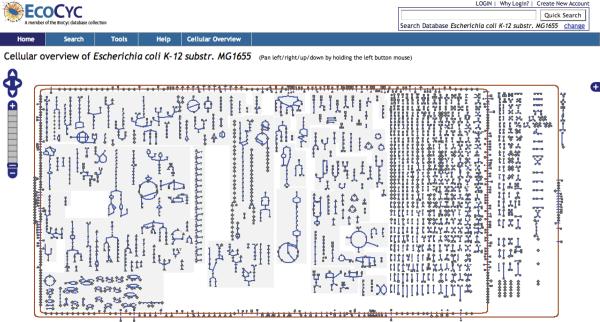
Figure 3.
The Cellular Overview of E. coli right after selecting the command Tools→Cellular Overview. The zoom ladder is at level 1, the lowest level, so that we can see all the metabolic pathways. At this zoom level, not enough space is available to display the names of compounds, enzymes, and pathways.

