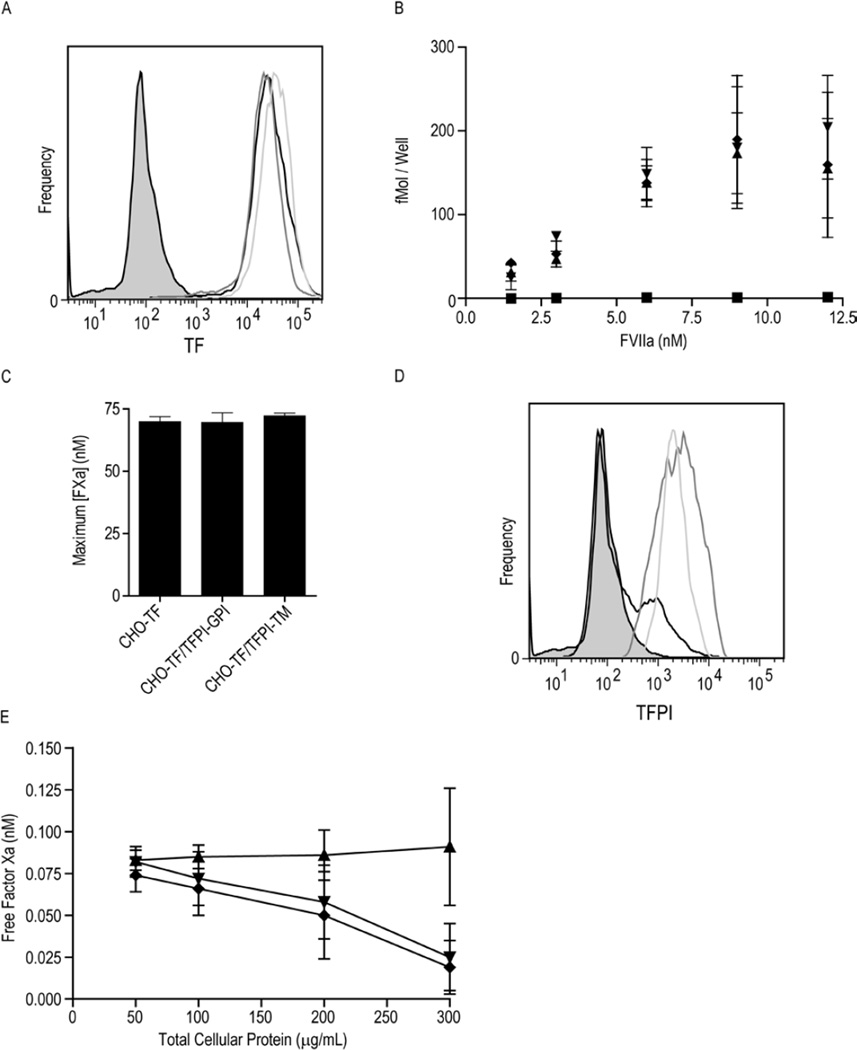
Figure 1. TF and TFPI expression on CHO-TF, CHO-TF/TFPI-GPI and CHO-TF/TFPI-TM cells.
A) Flow cytometric analysis of cell surface TF expression on CHO-TF (black), CHO-TF/TFPI-GPI (dark grey) and CHO-TF/TFPI-TM (light grey) cells. The MOPC isotype control is shaded gray. B) 125I-fVIIa binding to CHO-TF (▲), CHO-TF/TFPI-GPI (▼), CHO-TF/TFPI-TM (♦), and wild-type CHO cells (■); mean ± SD, n=4. C) Maximum concentration of fXa generated by CHO-TF, CHO-TF/TFPI-GPI, and CHO-TF/TFPI-TM cells (equivalent concentration of 300 µg/mL total cellular protein) pre-treated with 100 µg/mL monoclonal anti-TFPI antibody directed against the second Kunitz domain, assessed using the TF-fVIIa initiated fXa generation assay; mean ± SD, n=4. The assay was performed with cells in suspension. D) Flow cytometric analysis of cell surface TFPI on CHO-TF (black), CHO-TF/TFPI-GPI (dark grey) and CHO-TF/TFPI-TM (light grey) cells. The MOPC isotype control is shaded gray. E) Factor Xa inhibitory activity of CHO-TF/TFPI-GPI (▼), CHO-TF/TFPI-TM (♦) and CHO-TF (▲) cells in suspension at the indicated cellular concentrations; mean ± SD, n=6.

