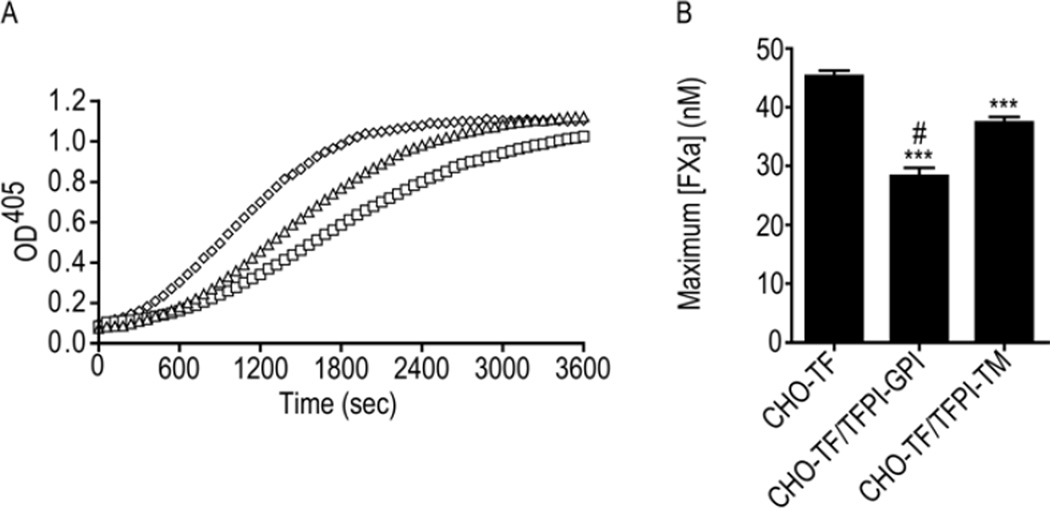
Figure 4. TFPI-GPI is a more effective inhibitor of TF-fVIIa than TFPI-TM.
A) Representative progress curves used to determine the maximum amount of fXa generated by TF-fVIIa on the surface of CHO-TF/TFPI-GPI (□), CHO-TF/TFPI-TM (△), or CHO-TF (◊) cells, at equivalent concentrations of 300 µg/mL total cellular protein. The plateau observed at an OD of approximately 1.0 represents substrate depletion. B) Maximum amount of fXa (nM) generated by CHO-TF, CHO-TF/TFPI-GPI, or CHO-TF/TFPI-TM cells by TF-fVIIa; mean ± SD, n=4. The assay was performed with cells in suspension. *** - p < 0.001 vs. CHO-TF; # - p < 0.001 vs. CHO-TF/TFPI-TM.

