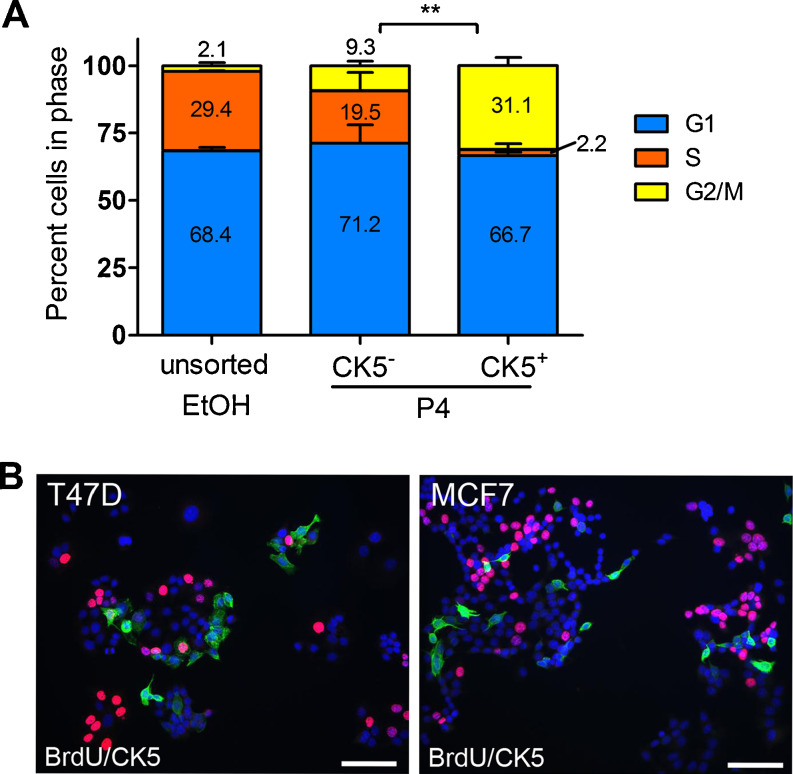
Fig. 5.
P4-induced CK5+ cells have decreased cell cycle compared to CK5- cells. a T47DK5pGFP cells were treated with vehicle (EtOH) or 100 nM P4 for 24 h, incubated with VyBrant DyeCycle Violet (Invitrogen), and cell cycle distribution of total vehicle-treated and P4-treated GFP−/+ (CK5−/+) cells measured by flow cytometry. Bars indicate percent of cells in each phase plus/minus SEM. **p < 0.01, CK5+ (GFP+) compared to CK5− (GFP−), two-way ANOVA/Tukey post test. b T47D cells were treated with 100 nM P4 for 24 h (+E2 for MCF7 cells), incubated with BrdU, and immunofluorescence for CK5 (green) and BrdU (red) performed. Cells were counterstained with DAPI. Scale bar, 50 μm

