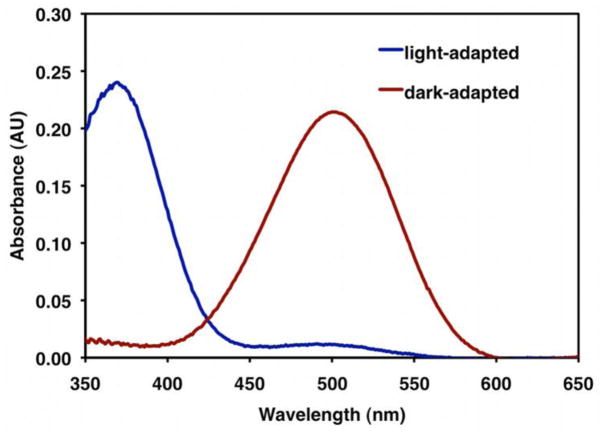
Figure 6. Solubilized Rhodopsin Absorption Spectrum.
The dark-adapted spectrum is shown in red while the light-adapted spectrum is shown in blue. The concentration of rhodopsin is calculated as a function of the absorbance difference between dark-adapted and light adapted rhodopsin at 500 nm (see Equations 1–3). Upon light activation, there is an observable shift in the absorbance maxima to 380 nm, the wavelength characteristic of metarhodopsin II.

