
Figure 1. Mapping of the mouse ES cell Ubiproteome.
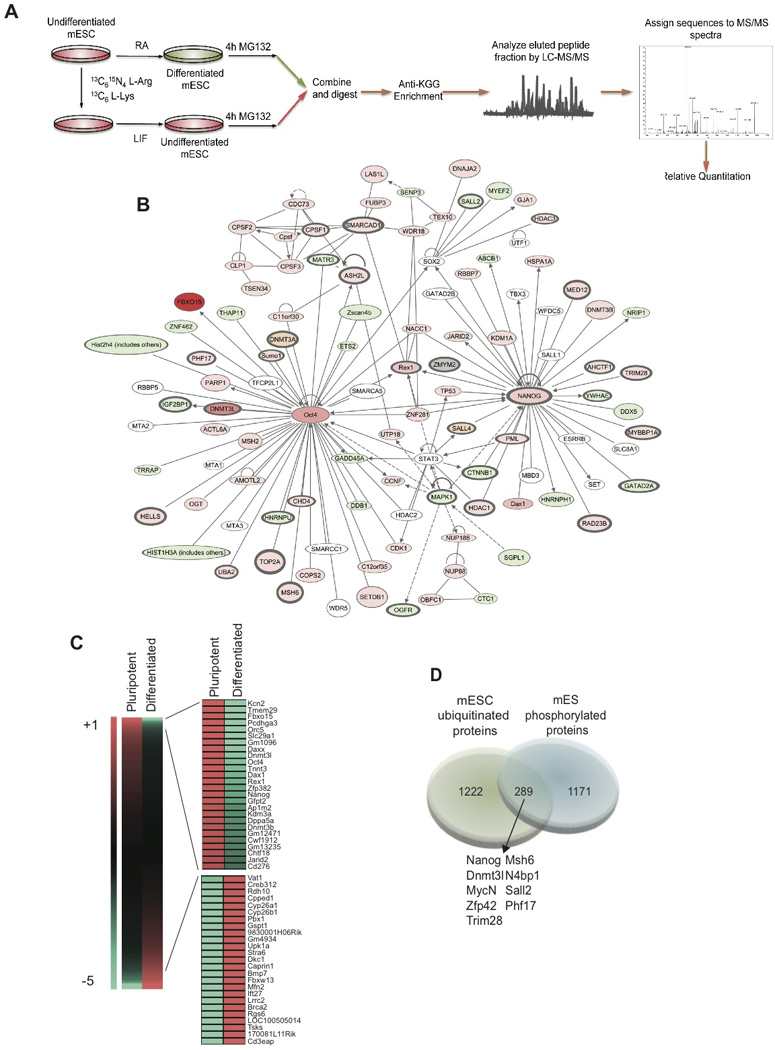
A) Scheme depicting the proteomic strategy followed using SILAC and MS/MS technology. B) Ingenuity Pathways-generated network with Nanog and Oct4 as nodes. Molecules in red show a higher ubiquitination rate in self-renewal conditions and in green in differentiated cells. Color intensities reflect ubiquitination detection values. White marks molecules that belong to the network and were not detected in our study. In orange are marked pluripotency factors only detected in the label-free experiments. Lines without arrows mean binding. Lines with arrows mean acting on. Dotted lines reflect an indirect interaction. C) Heat-map illustrating fold change of ubiquitinated peptides differentially detected in self-renewing ES cells and in differentiated cells. D) Venn diagram showing the overlap between the mouse phospho-proteome (Li et al, 2011) and the ubi-proteome obtained in this study. Common proteins are underlined in the pluripotency network in dark grey.