
Figure 3. UPS-targeted siRNA screen identifies genes required to maintain ES cell self-renewal and pluripotency.
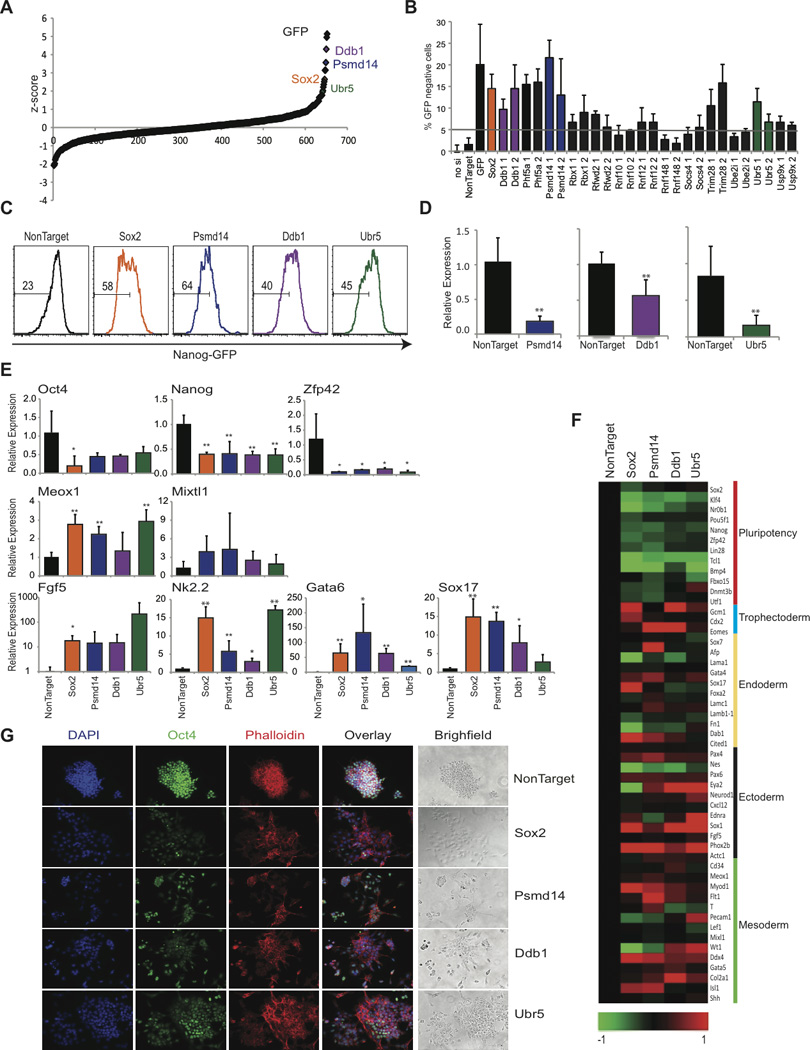
Nanog-GFP ES cells were transfected with pools of siRNAs under conditions of self-renewal and analyzed by FACS 48h later. A) Dot plot representing Z-score for all siRNAs. B) siRNA pool validation by individual siRNAs. C) FACS plots depicting loss of Nanog-GFP following siRNA transfection. D) Knockdown efficiency by qRT-PCR after siRNA transfection. E) Relative expression of pluripotency genes (Oct4, Nanog, Zfp42); endoderm genes (Gata6, Sox17); mesoderm (Meox1 and Mixtl1) and ectoderm genes (Nk2.2 and Fgf5) by qRT-PCR. Data represented as +SEM; N=3. *p-value <0.05, **p-value<0.01. F) Heat-map illustrating gene expression (log2). Selected pluripotency and differentiation genes are shown. G) Immunofluorescence and bright field images 48 hrs following siRNA knockdown. Staining for Oct4 (Green), Phalloidin (Red), and DAPI (Blue).