Figure 3.
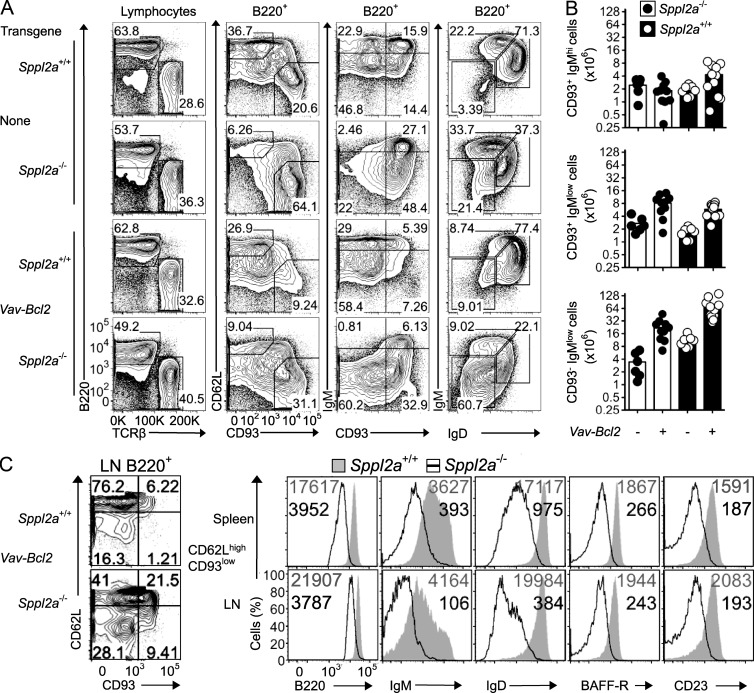
Overexpression of antiapoptotic BCL2 in Sppl2a−/− mice rescues accumulation of mature B cells. (A) Representative flow cytometric plots of lymphocytes in the spleen from mice of the indicated Sppl2a and Vav-Bcl2 genotypes. Pregates for plots are indicated above the columns. (B) Number of B cells of the indicated subsets in spleens from Sppl2a+/+ and Sppl2a−/− mice, either transgenic for Vav-Bcl2 or not. Bars show mean, and each symbol is a single mouse. (C) Representative flow cytometric plots of CD62L and CD93 expression on B cells from subcutaneous LNs in Vav-Bcl2 transgenic mice of the indicated genotype. Overlay of flow cytometric histograms for B220, IgM, IgD, BAFFR, and CD23 cell surface expression on CD62LhighCD93low mature B cells in spleen (top) or LNs (bottom) from Sppl2a+/+ (shaded gray) and Sppl2a−/− (black line) mice. Numbers in the plots indicate geometric mean fluorescence intensity for Sppl2a+/+ (gray; top) and Sppl2a−/− cells (black; bottom). Data are representative of one to three experiments with three to four mice per group (A and C) or combined from four experiments (B).

