Figure 1.
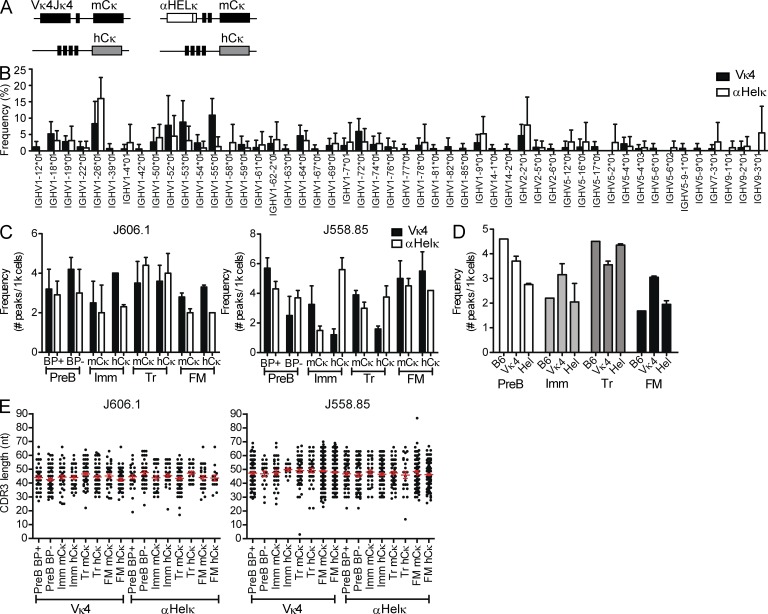
VH gene diversity in LC transgenic mice. (A) Diagram of κ loci in IgκVκ4/h and Igκαhel/h knockin mice. (B) VH gene usage of edited and unedited AA4− mature cells sorted from IgκVκ4/h and Igκαhel/h mice. Analysis of 141 HC sequences from five IgκVκ4/h mice and 96 HC sequences from five Igκαhel/h mice is shown. ANOVA indicated no significant difference between the VH gene repertoires of Vκ4 and αHELκ mice. Error bars indicate SD of the mean. (C) Frequencies of VH-JH2 rearrangements. B cells from 12-wk-old mice were sorted into different fractions based on developmental stage (as specified in Fig. S1) and LC cell surface phenotype (where applicable). Genomic DNA from each cell fraction was analyzed by CDR3 spectratyping, and the numbers of peaks were counted per 1,000 cells for VH J606.1–JH2 (left) and J558.85–JH2 (right). Mean VH peak numbers with ± SEM are shown for BM B220+CD43−IgM−pre-B (BP+ vs. BP−) and mCκ versus hCκ immature (Imm), splenic transitional (Tr), and FM B cells from IgκVκ4/h (closed bars) and Igκαhel/h (open bars) mice. Shown are data from cells sorted from two individual mice for each genotype in two independent experiments. (D) Similar frequencies of VH J606.1-JH2 rearrangements in B6, IgκVκ4/h, and Igκαhel/h. VH peak number analysis in pre-B, Imm, Tr, and FM of B6, IgκVκ4/h, and Igκαhel/h mice is shown. The same data for IgκVκ4/h and Igκαhel/h mice from panel B are replotted here, but rearrangements per 1,000 sorted B cells were calculated by combining both the sorted mCκ and hCκ populations to facilitate comparison with wild-type B6 mice (which have two mouse κ alleles). Plotted are the frequencies of VH J606.1–JH2 with mean ± SEM in both IgκVκ4/h and Igκαhel/h mice. No SEM is given for B6 because the B6 analysis was performed on two pooled 12-wk-old mice. (E) VH CDR3 length distribution comparison in B subsets of IgκVκ4/h and Igκαhel/h mice. The CDR3 lengths (nt) of VH-JH2 rearrangements in genomic DNA of sorted cell populations were calculated based on CDR3 spectratyping performed in B and C. Each dot represents a single rearrangement. Error bars indicate SEM.

