Figure 4.
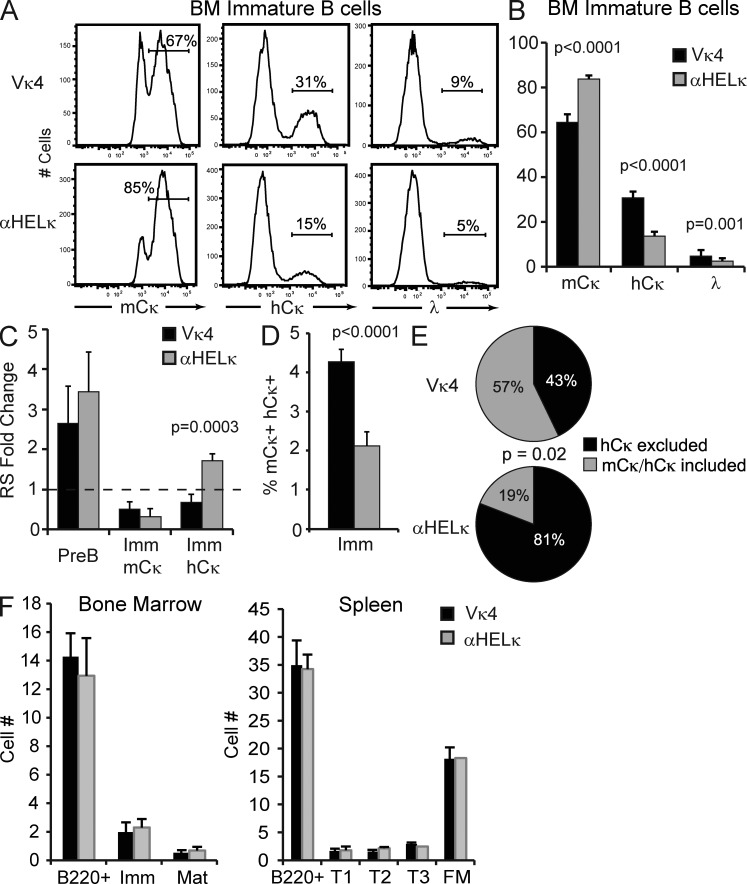
Central tolerance in IgκVκ4/h and Igκαhel/h mice. (A) Representative example of LC usage of B220+IgM+CD23− immature BM B cells as determined by flow cytometry. (B) Percentage of mCκ+, hCκ+, or λ+ cells within the immature BM B cell fraction in IgκVκ4/h and Igκαhel/h mice. Mean with SD of at least 12 mice from five independent experiments is shown. (C) The levels of RS elements were determined by quantitative PCR from genomic DNA isolated from sorted BM B cell fractions. Shown is the fold change in RS levels relative to splenic FM κ+ B cells sorted from wild-type B6 mice. Mean with SD of at least three experiments is shown. (D) Percentage of immature BM B cells coexpressing on the cell surface mCκ and hCκ as determined by flow cytometry. Mean with SD of nine mice from three independent experiments is shown. (E) mCκ−hCκ+ surface positive transitional B cells were single-cell sorted, and the presence of mCκ and hCκ mRNA was determined by RT-PCR in each sorted cell. Shown is the percentage of sorted cells from each mouse type that expressed only the hCκ allele (hCκ excluded) or both the mCκ+ and hCκ+ allele (mCκ+hCκ+ included) from a total of 87 (IgκVκ4/h) or 46 (Igκαhel/h) cells sorted in two independent experiments. Statistic used was the χ2 test p-value. (F) Absolute number of B cell developmental subsets in the BM and spleen in IgκVκ4/h and Igκαhel/h knockin mice. Mean with SD of six mice is shown.

