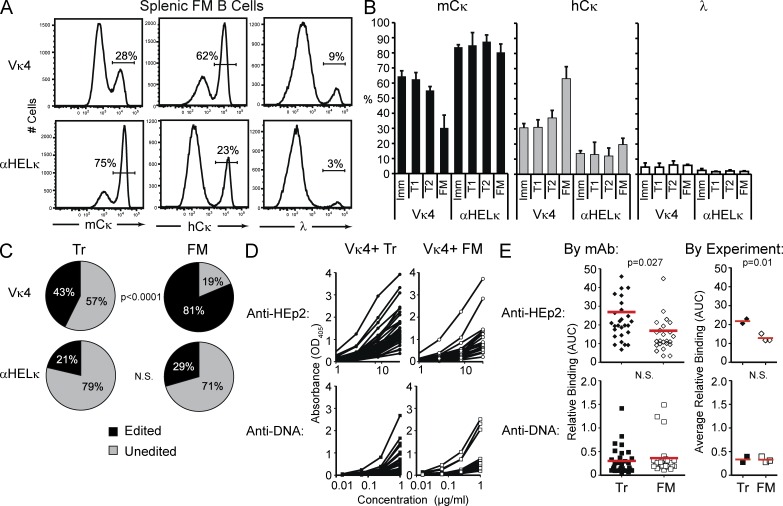
Figure 5.
Peripheral tolerance in IgκVκ4/h and Igκαhel/h mice. (A) Representative example of LC usage of splenic FM B cells as determined by flow cytometry. (B) Mean percentage of BM immature, splenic T1 and T2, and FM B cells expressing mCκ, hCκ, or λ on their cell surface. Shown is the mean of at least 16 mice from five independent experiments. Error bars indicate SD of the mean. Student’s t test p-values are as follows: Vκ4-mCκ: T1 versus FM, P < 0.0001; T1 versus T2, P < 0.0001; T2 versus FM, P < 0.0001. Vκ4-hCκ: T1 versus FM, P < 0.0001; T1 versus T2, P = 0 0.006; T2 versus FM, P < 0.0001. αHELκ-mCκ: T1 versus FM, P = 0.07; T2 versus FM, P = 0.0004. αHELκ-hCκ: T1 versus FM, P = 0.007; T2 versus FM, P = 0.0001. (C) Percentage of splenic Tr and FM B cells expressing the LC knockin (unedited) or an alternative LC (edited mCκ, hCκ, or λ) through receptor editing. To differentiate between mCκ+ cells that still expressed the LC knockin or had undergone receptor editing on the mCκ allele, mCκ surface–positive cells were single-cell sorted, and the variable portion of the κ allele was sequenced. Statistic used was the χ2 test p-value. (D and E) The HC variable region cloned from single-cell sorted unedited Tr (closed symbols) and FM (open symbols) B cells isolated from pooled IgκVκ4/h mice in two (Tr) or three (FM) independent experiments was cloned and paired with the Vκ4 LC to express mAbs. These were then tested for autoreactivity by HEp-2 cell and dsDNA ELISAs as described for Fig 2. Shown in D are the binding curves of each antibody and in E the AUC of HEp-2 or dsDNA binding for each antibody or the mean AUC (red lines) for antibodies isolated in each experiment.

