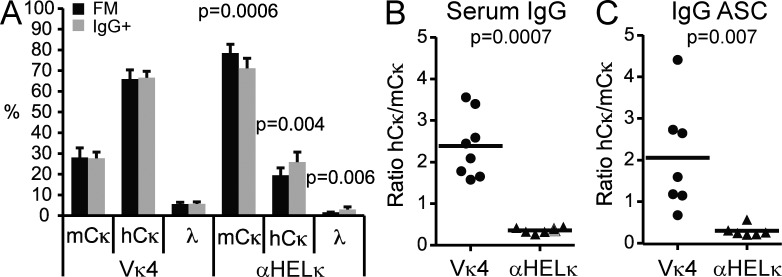
Figure 8.
Secondary tolerance in IgκVκ4/h and Igκαhel/h mice. (A) Splenic naive FM B cells and IgG1/2+ isotype-switched cells were gated, and the percentage of cells in each population that expressed mCκ, hCκ, or λ was determined by flow cytometry. Mean with SD of nine mice from three independent experiments is shown. (B) mCκ or hCκ serum IgG levels were determined by ELISA. Shown is the ratio of the OD values of hCκ relative to mCκ for each mouse. (C) IgG+ plasmablasts expressing the mCκ or hCκ allele in the spleen were detected by ELISPOT. Shown is the ratio of hCκ+ to mCκ+IgG+ antibody-secreting cells (ASC) for each mouse. (B and C) Horizontal lines indicate the mean.

