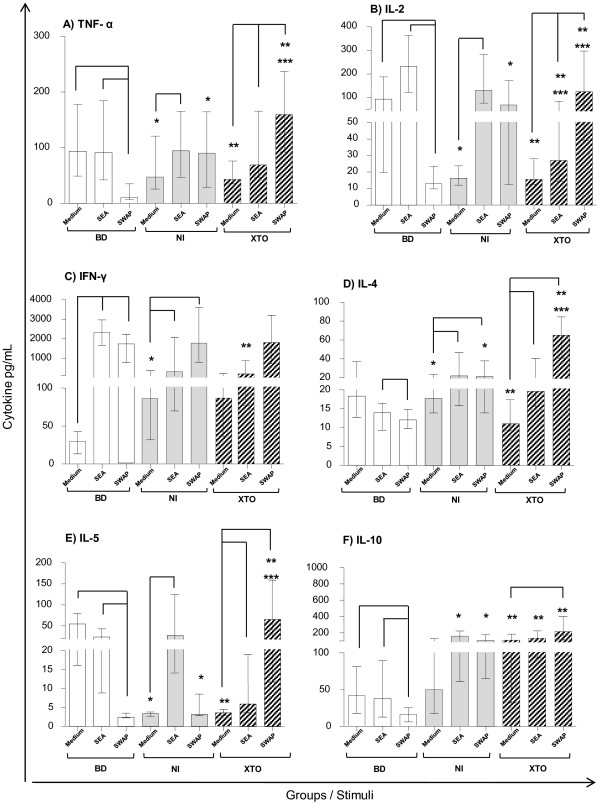
Figure 3.
Cytokine profile in the culture supernatants of PBMCs. Levels of the cytokines (A) TNF-α, (B) IL-2, (C) IFN-γ, (D) IL-4, (E) IL-5 and (F) IL-10 were quantified by the CBA system and flow cytometry in the PBMCs of individuals from each group. BD: n = 19, NI: n = 21 and XTO: n = 27. The egg counts in the XTO group ranged from 17 to 68 eggs/g of stool (mean = 36 eggs/g). The bars represent the median and interquartile range. The Kruskal-Wallis and Dunn's statistical tests were performed for statistical analysis. The inter-stimuli differences (p <0.05) are represented by lines. The inter-groups differences (p<0.05) are represented by asterisks: BD x NI (*); BD x XTO (**); NI x XTO (***). The results are expressed in pg/mL.

