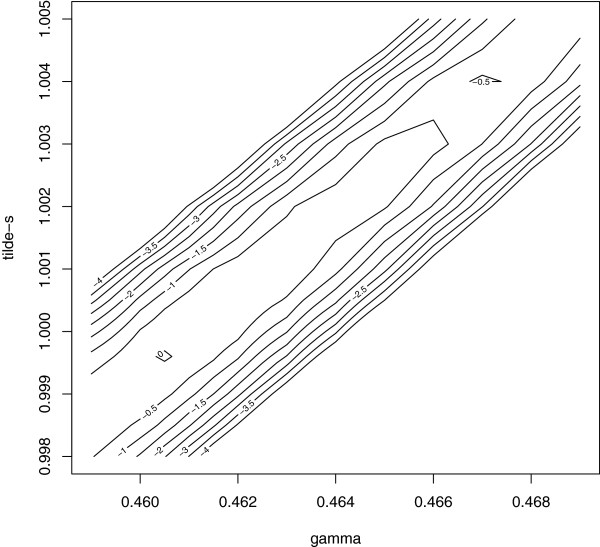
Figure 1.
Profile log-likelihood for γ and . A contour-plot of the profile log-likelihood for parameters γ and based on the full log-likelihood in equation (5); the plot is constructed with values in a discrete grid (explaining the roughness of the plot) that have been standardised such that the maximum value is zero.

