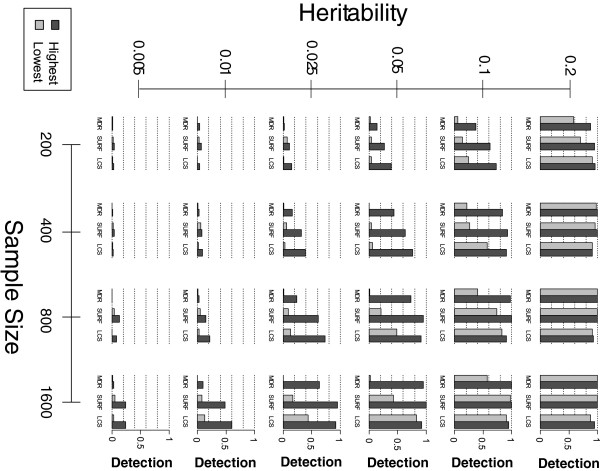
Figure 1.
2-Locus Model Detection: Each bar represents the model detection frequency (averaged between a MAF of 0.2 and 0.4) for the respective algorithm within 100 simulated datasets. Highest and lowest refers to the respective EDM of a given model within the model population generated by GAMETES. Each sub-plot corresponds to a specific combination of heritability and sample size. A similar figure for 3-locus models is included in the Additional file 1.

