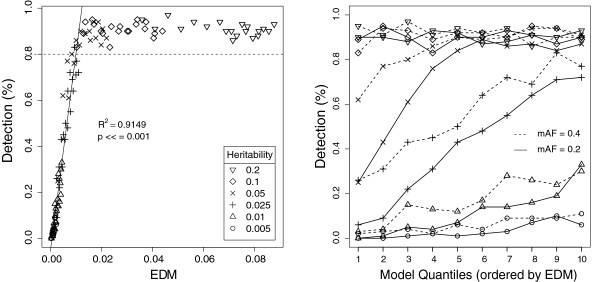
Figure 2.

Plots illustrating the follow-up MDR detection analysis over 10 quantiles. For all datasets in this analysis, K = 0.3, number of SNPs is 20, and sample size is 800. MAF and heritability vary as before. (Left Panel) The solid regression line gives the best fit for all findings with an observed detection frequency below the significant detection threshold of 0.8 (the dotted line). Similar figures for COR and PTV are given in the Additional file 1. (Right Panel) A different perspective on the data in the left panel. This plot illustrates the capacity of model architecture to impact model detection independent of any genetic or dataset constraints. The x-axis gives the ten models selected to cover the range of EDMs observed. Each line highlights the ability to find these ten models for a respective combination of heritability and MAF.
