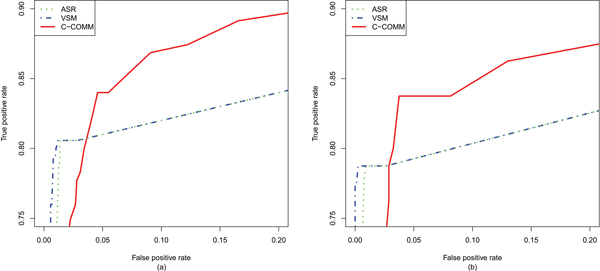
Figure 2.

ROC curves for the experimental results on the gold-standard sets. ROC curves for the experimental results on the gold-standard sets of yeast (a) and human (b) calculated with CroGO (red), VSM (blue) and ASR (green). ASR and VSM based measures have very similar trends, and are overlapping for most of the visible portion of the ROC curves.
