Figure 4.

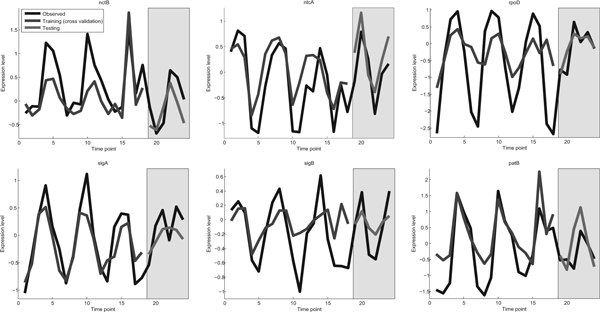
Observed and predicted expression level for selected TFs. Yellow bar represents testing conditions. (In gray scale: shaded bar-testing conditions, black line-observed expression, gray line-predicted expression).

Observed and predicted expression level for selected TFs. Yellow bar represents testing conditions. (In gray scale: shaded bar-testing conditions, black line-observed expression, gray line-predicted expression).