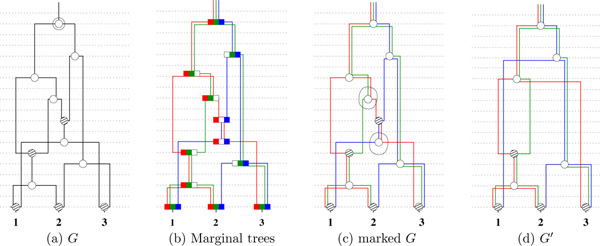
Figure 1.

The topology of an ARG. (a) The topology of an ARG G with three extant samples marked 1, 2 and 3. The dashed horizontal lines mark the age or depth of the nodes which are the same in all the four figures. (b) The three nonmixing segments are red, green and blue, in that order. Each node displays the nonmixing segments. A white rectangle indicates the absence of that segment in that node. The three embedded trees, corresponding to each segment, are shown in the same color as that of the segment. The edge labels (mutation events) are not shown to avoid clutter. (c) The same as (b) with the two marked nodes that are not t-coalescent. (d) Removing the marked nodes to obtain a minimal descriptor G'.
