
Figure 2.
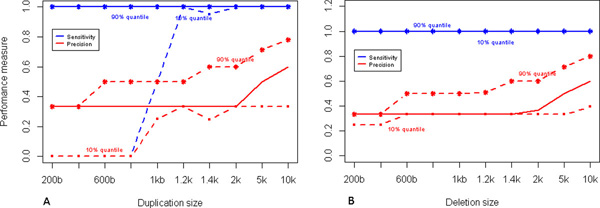
Performance at different variations sizes. Performance of CoNVEX when detecting short variations. Performance is measured by sensitivity and precision. Both graphs show median (solid lines), 0.1 quantile (dashed lines) and 0.9 quantile (dashed lines) of the results from 100 simulations of (A) duplication and (B) deletions. The solid blue line shows the median sensitivity and the solid red line shows the median precision. The sizes considered are 200, 400, 600, 800, 1 k, 1.2 k, 1.4 k, 2 k, 5 k and 10 k bases.