
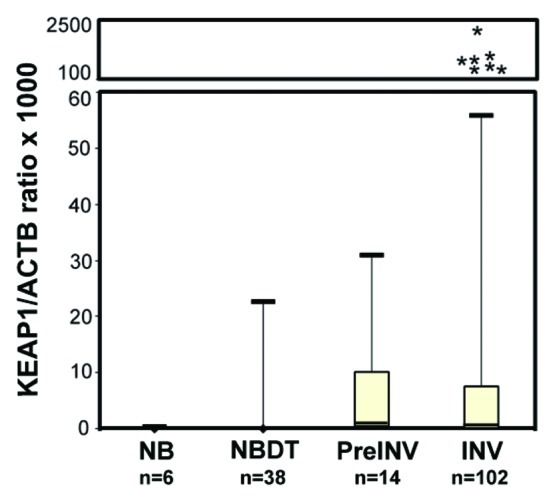
Figure 1. Boxplots of KEAP1 promoter methylation levels in normal breast tissues from reductive mammoplasty (NB), normal breast distant from tumor (NBDT), pre invasive lesions (PreINV) and invasive cancer (INV). Methylation levels are expressed as the KEAP1/ACTB ratio multiplied by 1,000. The boxes mark the interquartile range, (interval between the 25th and 75th percentile). The lines inside the boxes denote median values, *denote the outliers.