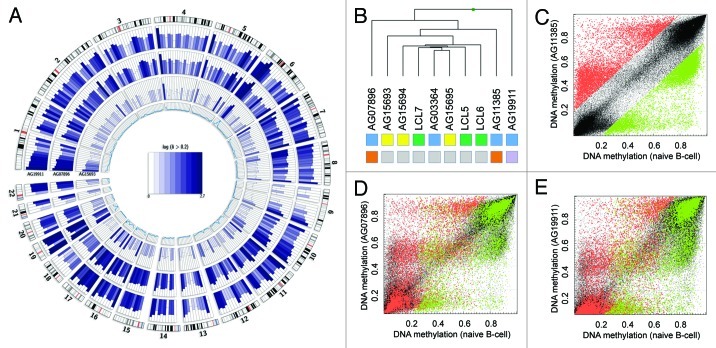
Figure 2. Mutant patients exhibit global DNA methylation differences. (A) Genome-wide DNA methylation changes of a non-mutant (AG15693), a WRN gene mutant (AG07896, AG11385) and a LMNA gene mutant (AG19911) premature aging patient compared with a healthy donor (LCL6) and displayed by Circos representation.21 Displayed in color-code are the number of differentially methylated CpG site (δ average β-value > 0.2) in windows of 10 Mbp width. The inner circle represents the total number of analyzed CpG sites in the respective window (0–7,000). (B) Unsupervised hierarchical clustering of healthy donors (green) or HGP (yellow) and WS (blue) patient samples. Gene mutations are indicated (WRN: orange, LMNA, purple; non-mutant: gray). (C) Absolute DNA methylation levels of AG11385 (WRN mutant) and LCL6 (healthy donor). Highlighted are hypomethylated (δ < -0.2, green) and hypermethylated (δ > 0.2, red) CpG sites in respect the healthy control (LCL6). (E) Absolute DNA methylation level of AG07896 (WRN mutant) and LCL6 (healthy donor). Highlighted are hypomethylated (green) and hypermethylated (red) CpG sites of AG11385. (D) Absolute DNA methylation level of AG19911 (LMNA mutant) and LCL6 (healthy donor). Highlighted are hypomethylated (green) and hypermethylated (red) CpG sites of AG11385.

An official website of the United States government
Here's how you know
Official websites use .gov
A
.gov website belongs to an official
government organization in the United States.
Secure .gov websites use HTTPS
A lock (
) or https:// means you've safely
connected to the .gov website. Share sensitive
information only on official, secure websites.
