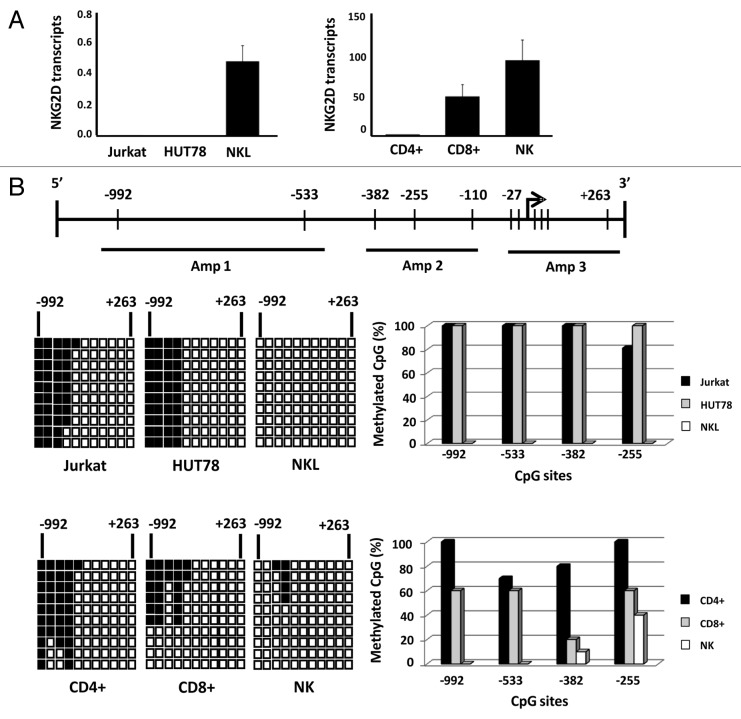
Figure 1. Differential expression of NKG2D gene in T and NK cell lines and lymphocyte subsets is correlated with DNA methylation pattern.(A) NKG2D transcription levels were determined by qRT-PCR in Jurkat, HUT78 and NKL cell lines, and isolated CD4+ T, CD8+ T and NK cells from healthy donors. Histograms represent the relative expression of NKG2D gene normalized with respect to the housekeeping gene GAPDH. Data are presented as the mean ± SD of five independent experiments. (B) Graphic representation of the NKG2D gene. Arrow: translation start site; filled bars: distribution and position of CpG sites; horizontal black lines: regions amplified with specific primers shown in Table 1. The methylation pattern of each cell type was analyzed by bisulfite sequencing. Rows: ten individual sequenced clones; columns: CpG sites; closed squares: methylated CpG sites; open squares: unmethylated CpG sites. The right-hand graphs show the total percentage methylation for each sample.

An official website of the United States government
Here's how you know
Official websites use .gov
A
.gov website belongs to an official
government organization in the United States.
Secure .gov websites use HTTPS
A lock (
) or https:// means you've safely
connected to the .gov website. Share sensitive
information only on official, secure websites.
