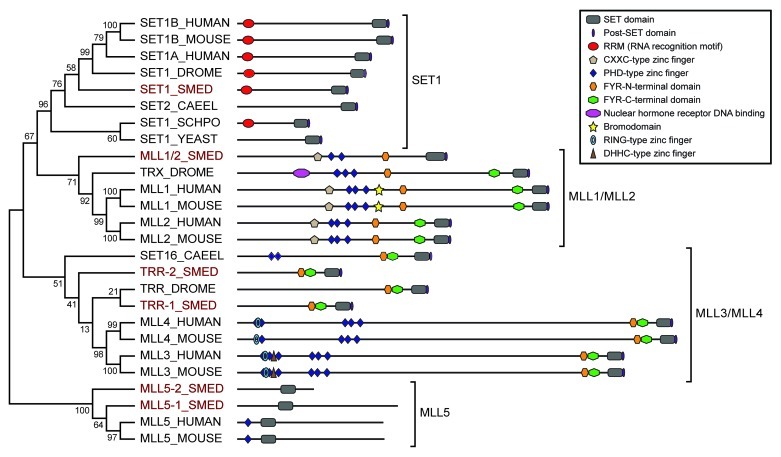
Figure 1. Phylogenetic tree of SET1/MLL family proteins. Relationships of planarian SET1/MLL proteins (highlighted in red) to those of other species based on Neighbor-joining analysis of their SET domains. Numbers represent the percentage of Bootstrap replicates that include that node. The predicted domain structure of each protein is diagramed to the right. The members of the larger family fall into four sub-groups indicated by brackets. Sequences were selected from Homo sapiens (HUMAN), Mus musculus (MOUSE), Caenorhabditis elegans (CAEEL), Schizosaccharomyces pombe (SCHPO), Saccharomyces cerevisiae (YEAST), Drosophila melanogaster (DROME) and Schmidtea mediterranea (SMED).

An official website of the United States government
Here's how you know
Official websites use .gov
A
.gov website belongs to an official
government organization in the United States.
Secure .gov websites use HTTPS
A lock (
) or https:// means you've safely
connected to the .gov website. Share sensitive
information only on official, secure websites.
