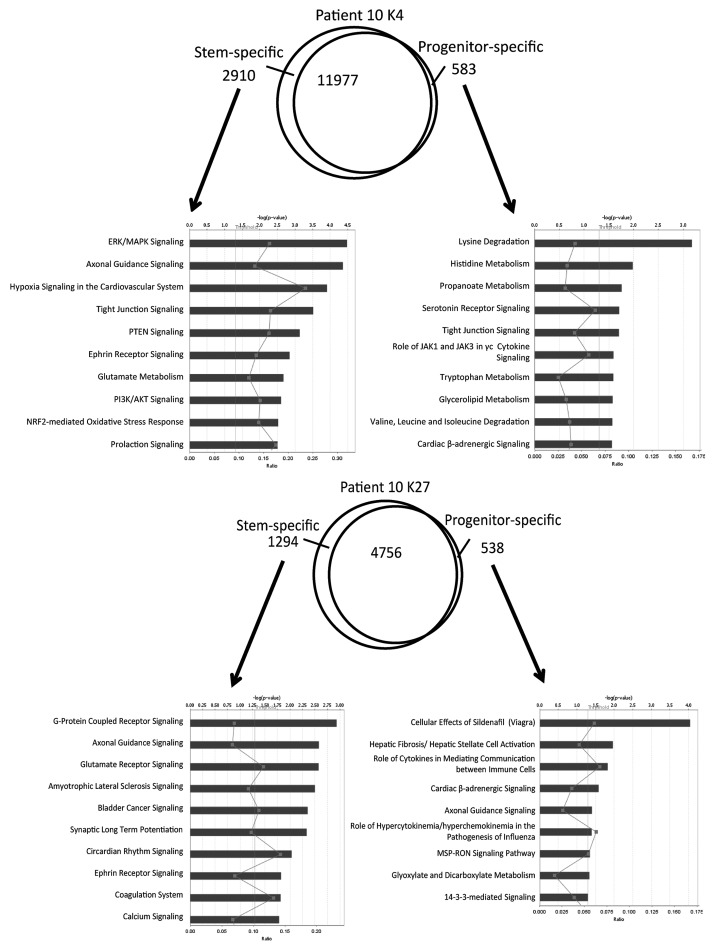
Figure 4. Pathway analysis for genes enriched in K4 (upper) or K27 (lower) in P10. The Venn diagrams show overlap in genes marked by K4 or K27 in their promoters. Ingenuity pathway analysis was performed with the exclusively enriched genes in stem or progenitor cells. Bars show p values in –log (p value) for each pathway. Rectangles on each bar show ratio calculated by the number of molecules in a given pathway divided by total number of molecules that make up that pathway. Pathways are listed in order of a rank from the most associated pathway.

An official website of the United States government
Here's how you know
Official websites use .gov
A
.gov website belongs to an official
government organization in the United States.
Secure .gov websites use HTTPS
A lock (
) or https:// means you've safely
connected to the .gov website. Share sensitive
information only on official, secure websites.
