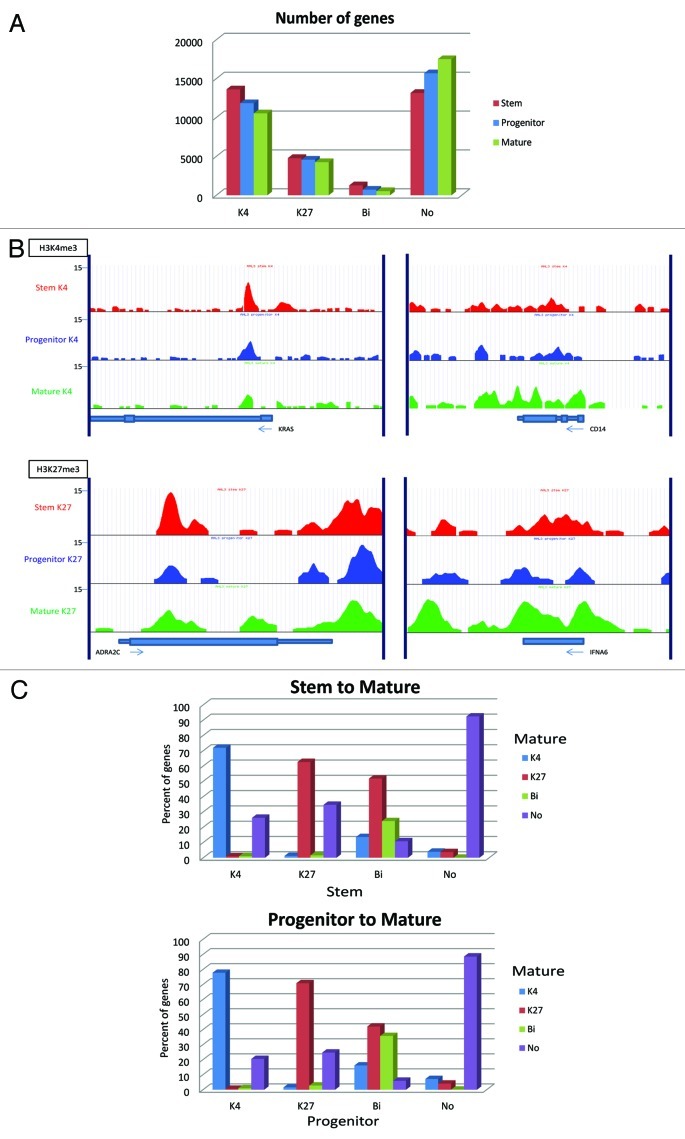
Figure 7. Chromatin changes from stem to progenitor to the most differentiated cells (mature cells). (A) Comparison of numbers of promoter genes with respective histone status. (B) Representative histone modification patterns of K4-enrichment for a stem-cell gene (KRAS) and a differentiation marker (CD14) and K27-enrichment of a stem-cell gene (ADRA2C) and a mature-cell gene (IFNA6). (C) K4/K27 mark change upon differentiation in Patient 10. Percentages of each histone status are shown in in bar graphs for differentiation from stem to mature cells (upper) and from progenitor to mature cells (lower).

An official website of the United States government
Here's how you know
Official websites use .gov
A
.gov website belongs to an official
government organization in the United States.
Secure .gov websites use HTTPS
A lock (
) or https:// means you've safely
connected to the .gov website. Share sensitive
information only on official, secure websites.
