
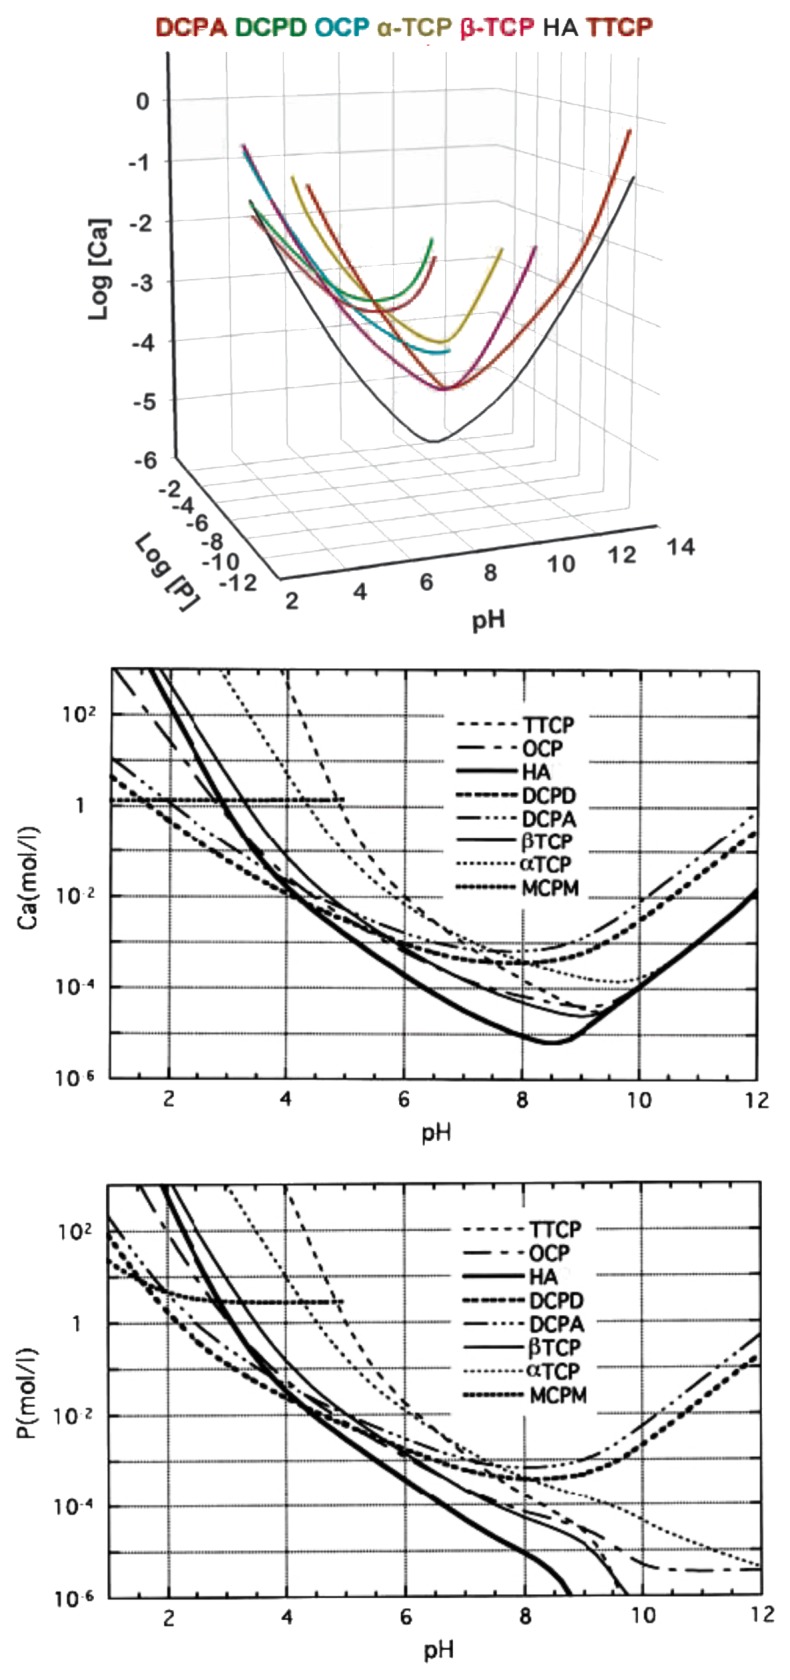
Figure 6. Top: a 3D version of the classical solubility phase diagrams for the ternary system Ca(OH)2-H3PO4-H2O. Reprinted from reference 118 with permission. Middle and bottom: solubility phase diagrams in two-dimensional graphs, showing two logarithms of the concentrations of (a) calcium and (b) orthophosphate ions as a function of the pH in solutions saturated with various salts. Reprinted from reference 119 with permission.